- Title
-
PDE10A inhibition reduces the manifestation of pathology in DMD zebrafish and represses the genetic modifier PITPNA
- Authors
- Lambert, M.R., Spinazzola, J.M., Widrick, J.J., Pakula, A., Conner, J.R., Chin, J.E., Owens, J.M., Kunkel, L.M.
- Source
- Full text @ Mol. Ther.
|
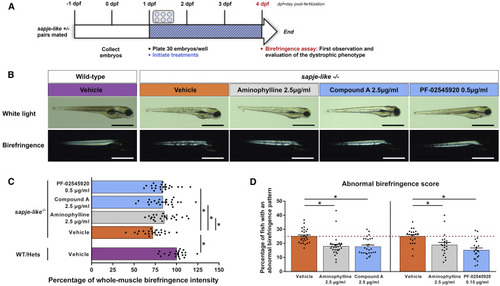
Short-Term Birefringence Screening Assay in Dystrophin-Deficient Zebrafish Identifies Phosphodiesterase 10A (PDE10A) Inhibitors That Reduce the Manifestation of the Dystrophic Muscle Phenotype (A) Design of short-term birefringence screening assay in dystrophin-deficient sapje-like zebrafish: pairs of sapje-like+/− zebrafish were mated and treatments were applied to the progeny in six-well plates (30 embryos per well) from 1 day post-fertilization (dpf). At 4 dpf, a birefringence assay was performed. (B) White light and birefringence images of representative 4-dpf larvae treated with 0.1% DMSO (vehicle, control), 2.5 μg/mL aminophylline (positive control), 2.5 μg/mL compound A, or 0.5 μg/mL PF-02545920 (two PDE10A inhibitors from Pfizer). Scale bars represent 1 mm. (C) Dot plots showing percentage of whole-muscle birefringence intensity of 4-dpf larvae. The whole-muscle birefringence intensity was normalized to the area of measure and larvae were genotyped. At least 22 (n = 22) zebrafish per experimental treatment were analyzed in three (N = 3) independent experiments. Statistical differences between groups are presented as follows: ∗p < 0.05 (t test, ±SEM). WT, wild-type larvae; Hets, heterozygous sapje-like+/− larvae. (D) Dot plots showing percentage of 4-dpf larvae that display abnormal muscle birefringence pattern (named as abnormal birefringence score) in each well. Mendelian genetics dictates 25% of the progeny to be dystrophin null and exhibit the muscle dystrophic phenotype seen by birefringence (red dashed line). Experimental treatments were performed in triplicate wells in at least seven (N = 7) independent experiments. Statistical differences between groups are presented as follows: ∗p < 0.05 (t test, ±SEM). PHENOTYPE:
|
|
pde10A Morpholino Reduces the Manifestation of the Dystrophic Muscle Birefringence Phenotype in Dystrophin-Deficient Zebrafish (A) Design of morpholino study: pairs of sapje-like+/− zebrafish were mated and pde10A morpholino or standard control morpholino (negative control) was injected in one-cell-stage progeny embryos. At 4 dpf, a birefringence assay was performed and unaffected (normal muscle birefringence phenotype) as well as affected larvae (abnormal muscle birefringence phenotype) were sorted to conduct genotyping or further analysis. In each experiment, morphant zebrafish (morpholino-injected larvae [MO]) were compared to non-injected siblings (non-injected larvae [NI]). (B) At 4 dpf, total proteins were extracted from 20 (n = 20) zebrafish per biological replicate and western blotting was performed. Upper panel: representative western blot images from Pde10a and Gapdh antibodies. Lower panel: bar graph showing Pde10a protein expression normalized to Gapdh. At least four (N = 4) independent experiments were performed. Statistical differences between groups are presented as follows: ∗p < 0.05 (t test, ±SEM). (C) White light, birefringence, and phalloidin staining images of representative 4-dpf larvae. Scale bars of white light and birefringence panels represent 1 mm. Scale bars of phalloidin staining panel represent 100 μm. (D) Dot plots showing percentage of whole-muscle birefringence intensity of 4-dpf larvae in pde10a morpholino experiments and control morpholino experiments. The muscle birefringence intensity was normalized to the respective area of measure, and larvae were genotyped. SL−/−, dystrophin null sapje-like−/− larvae. Twenty-one to 23 (n = 21–23) zebrafish per group were analyzed in three (N = 3) independent experiments. Statistical differences between groups are presented as follows: ∗p < 0.05 (t test, ±SEM). (E) Dot plots showing percentage of 4-dpf larvae that display an abnormal muscle birefringence pattern (named as abnormal birefringence score) in pde10a morpholino experiments and control morpholino experiments. Mendelian genetics dictates 25% of the progeny to be dystrophin null and exhibit the muscle dystrophic phenotype seen by birefringence (red dashed line). Each dot represents the percentage of zebrafish that display an abnormal muscle birefringence pattern in a cohort (n = 200–300) of non-injected or morphant siblings. Eight to 10 (N = 8–10) independent experiments were performed per condition. Statistical differences between groups are presented as follows: ∗p < 0.05 (t test, ±SEM). |
|
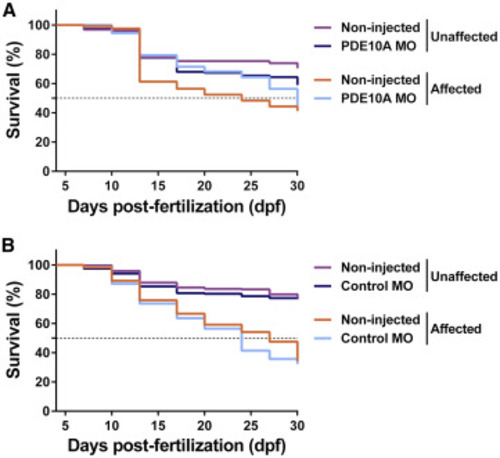
Lifespan Was Extended in pde10a Morphant Dystrophin-Deficient Zebrafish Pairs of sapje-like+/− zebrafish were mated and pde10a morpholino or standard control morpholino (negative control) was injected in one-cell-stage progeny embryos. At 4 dpf, a birefringence assay was performed and unaffected larvae (normal muscle birefringence phenotype) as well as affected larvae (abnormal muscle birefringence phenotype) were sorted. (A and B) From 4 to 30 dpf, the survival of larvae in (A) pde10a morpholino experiments and (B) control morpholino experiments was evaluated and compared to non-injected siblings. One hundred thirty to 300 (n = 130–300) zebrafish per group were analyzed in at least three (N = 3) independent experiments. Statistical differences between groups were determined from a log-rank test (p < 0.05). PHENOTYPE:
|
|
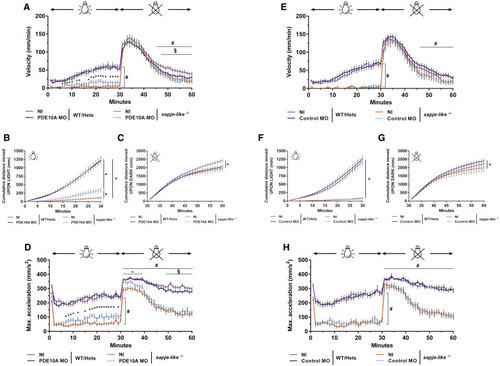
Improvement in Locomotion of pde10a Morphant Dystrophin-Deficient Zebrafish Pairs of sapje-like+/− zebrafish were mated and pde10a morpholino or standard control morpholino (negative control) was injected in one-cell-stage progeny embryos. At 4 dpf, a birefringence assay was performed and unaffected larva (normal muscle birefringence phenotype) as well as affected larvae (abnormal muscle birefringence phenotype) were set in 48-well plates. At 5 dpf, following a dark period of acclimation, a light/dark locomotion assay was performed in the DanioVision observation chamber (Noldus) and data were generated from EthoVision XT tracking software (Noldus). In each experiment, morphant zebrafish were compared to non-injected siblings. At the end of the experiment, fish were collected and genotyped. (A–D) pde10a morpholino experiments. (E–H) Standard control morpholino experiments. (A and E) Graphs show swimming velocity (mm/min) for the entire assay. # indicates statistical differences between NI SL−/− and NI WT/Hets larvae; asterisk (∗) indicates statistical differences between NI SL−/− and pde10a morphant SL−/− larvae; § indicates statistical differences between NI WT/Hets and pde10a morphant WT/Hets (p < 0.05, t test, ±SEM). (B and F) Graphs show cumulative distance traveled (mm) for 30-min light period. Statistical differences between groups are presented as follows: ∗p < 0.05 (t test, ±SEM). (C and G) Graphs show cumulative distance traveled (mm) for 30-min dark period following light-to-dark transition. Statistical differences between groups are presented as follows: ∗p < 0.05 (t test, ±SEM). (D and H) Graphs show maximum acceleration capacity (mm/s2) for the entire assay. # indicates statistical differences between NI SL−/− and NI WT/Hets larvae; asterisk (∗) indicates statistical differences between NI SL−/− and pde10a morphant SL−/− larvae; § indicates statistical differences between NI WT/Hets and pde10a morphant WT/Hets (p < 0.05, t test, ±SEM). From 90 to 230 (n = 90–230) zebrafish were analyzed per condition within at least four (N = 4) independent experiments. PHENOTYPE:
|
|
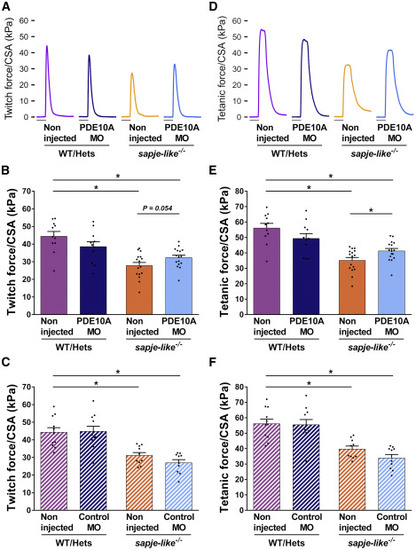
Increase in Specific Force Produced by pde10a Morphant Dystrophin-Deficient Zebrafish Pairs of sapje-like+/− zebrafish were mated and pde10a morpholino or standard control morpholino (negative control) was injected in one-cell-stage progeny embryos. At 4 dpf, a birefringence assay was performed and unaffected larvae (normal muscle birefringence phenotype) as well as affected larvae (abnormal muscle birefringence phenotype) were sorted. At 6–7 dpf, twitch and tetanic force were measured in the tails and normalized to the cross-section area (CSA). In each experiment, morphant zebrafish were compared to non-injected siblings. At the end of the experiment, fish were collected and genotyped. (A and D) Representative twitch (A) and tetanic force signal (D) are shown. Scale bars represent 50 ms. (B and C) Dot plots show twitch force (kPa) in (B) pde10a morpholino experiments and (C) control morpholino experiments. (E and F) Dot plots showing tetanic force (kPa) in (E) pde10a morpholino experiments and (F) control morpholino experiments. Eleven to 16 (n = 11–16) zebrafish per group were analyzed within at least three (N = 3) independent experiments. Statistical differences between groups are presented as follows: ∗p < 0.05 (t test, ±SEM). PHENOTYPE:
|
|
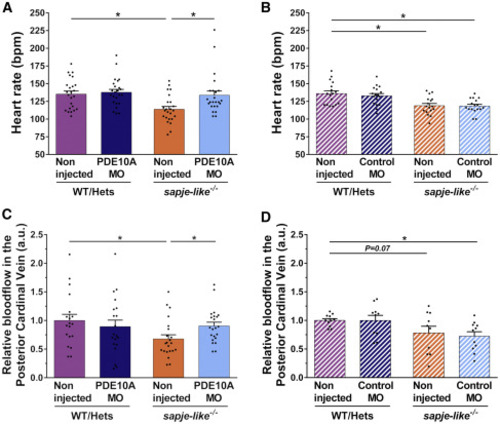
Improvement in Cardiovascular Activity of pde10a Morphant Dystrophin-Deficient Zebrafish Pairs of sapje-like+/− zebrafish were mated and pde10a morpholino or standard control morpholino (negative control) was injected in one-cell-stage progeny embryos. At 4 dpf, a birefringence assay was performed and unaffected larva (normal muscle birefringence phenotype) as well as affected larvae (abnormal muscle birefringence phenotype) were sorted. At 5 dpf, anesthetized larvae were recorded for at least 30 s under a microscope. In each experiment, morphant zebrafish were compared to non-injected siblings. At the end of the experiment, fish were collected and genotyped. (A and B) Dot plots show the heart rate (beats per minute [bpm]) of 5-dpf larvae in (A) pde10a morpholino experiments and (B) control morpholino experiments. Seventeen to 24 (n = 17–24) zebrafish were analyzed within at least three (N = 3) independent experiments. Statistical differences between groups are presented as follows: ∗p < 0.05 (t test, ±SEM). (C and D) Dot plots show blood flow (arbitrary units [a.u.]) of posterior cardinal vein in (C) pde10a morpholino experiments and (D) control morpholino experiments. Blood flow was measured by using DanioScope software (Noldus). Ten to 22 (n = 10–22) zebrafish were analyzed within at least three (N = 3) independent experiments. Statistical differences between groups are presented as follows: ∗p < 0.05 (t test, ±SEM). PHENOTYPE:
|
|
PDE10A Inhibition Leads to Reduction of PITPNA Expression in Dystrophin-Deficient Zebrafish and DMD Patient-Derived Myoblasts Pairs of sapje-like+/− zebrafish were mated and pde10a morpholino or standard control morpholino (negative control) was injected in one-cell-stage progeny embryos. At 4 dpf, a birefringence assay was performed and unaffected (normal muscle birefringence phenotype) as well as affected larvae (abnormal muscle birefringence phenotype) were collected. In each experiment, morphant zebrafish were compared to non-injected siblings. (A) Total mRNA was extracted from 10 (n = 10) zebrafish per biological replicate and TaqMan qRT-PCR was performed. Bar graphs show pitpna mRNA expression normalized to hprt1. In each experiment, the replicate was run three times and at least five (N = 5) independent experiments were performed. Statistical differences between groups are presented as follows: ∗p < 0.05 (t test, ±SEM). (B) Total proteins were extracted from 20 (n = 20) zebrafish per biological replicate and western blotting was performed. Upper panel: representative western blot images from Pitpna and Gapdh antibodies. Lower panel: bar graph showing Pitpna protein expression normalized to Gapdh. At least four (N = 4) independent experiments were performed. Statistical differences between groups are presented as follows: ∗p < 0.05 (t test, ±SEM). (C) In a primary culture of CD56-positive myoblasts and myotubes (at day 6 of differentiation) from DMD patients, 25 μM PDE10A inhibitor PF-02545920 or 0.25% DMSO (control) was applied for 24 h. Total mRNA was extracted and TaqMan qRT-PCR was performed. Bar graph shows PITPNA mRNA expression normalized to GAPDH. (D) Total proteins were extracted and western blotting was performed. Upper panel: representative western blot images with PITPNA and GAPDH antibodies. Lower panel: bar graph showing PITPNA protein expression normalized to GAPDH. In each experiment, two DMD patient cell lines were used, and replicates were run three times in at least three (N = 3) independent experiments. Statistical differences between groups are presented as follows: ∗p < 0.05 (t test, ±SEM). |

