FIGURE SUMMARY
Title

A point mutation decouples the lipid transfer activities of microsomal triglyceride transfer protein

Authors
Wilson, M.H., Rajan, S., Danoff, A., White, R.J., Hensley, M.R., Quinlivan, V.H., Recacha, R., Thierer, J.H., Tan, F.J., Busch-Nentwich, E.M., Ruddock, L., Hussain, M.M., Farber, S.A.
Source
Full text @ PLoS Genet.

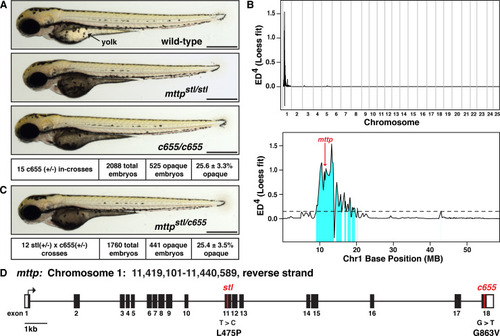
The <italic>c655</italic> allele is a missense mutation in the M-subunit of microsomal triglyceride transfer protein.

(A) Representative images of a wild-type zebrafish embryo, a homozygous mutant embryo carrying the previously described stalactite (stl) missense mutation in mttp, and a homozygous c655 mutant embryo at 3 days post fertilization (dpf); Scale = 500 μm. The dark/opaque yolk phenotype in embryos from c655 heterozygous in-crosses segregated with a Mendelian ratio consistent with a homozygous recessive mutation, mean +/- SD. For source data, see S4 File. (B) Euclidean distance mapping analysis plots produced by MMAPPR [51], showing the likely genomic region of the c655 mutation. Plot of the LOESS fit to the mapping scores (Euclidean Distance4) across all 25 chromosomes (top) and expanded view of chromosome 1(GRCz10: CM002885.1) (bottom). Single nucleotide variants (SNVs) present in this 11 MB region in c655 mutant embryos were assessed for their effect on annotated genes using the Ensembl Variant Effect Predictor [52], including using the Sorting Intolerant from Tolerant algorithm (SIFT) [53], to predict the impact of changes on protein-coding sequence (tolerated or deleterious). We extracted variants that alter the protein-coding sequence as candidates for the causal mutation (223 variants in 64 genes, of which 42 are missense variants predicted to be deleterious; S1 File). One of the SNVs linked to the c655 phenotype was a G>T missense mutation predicted to be deleterious in exon 18 of the microsomal triglyceride transfer protein gene (ENSDARG00000008637, Chr1:11,421,261 GRCz10, red arrow in B shows the position of the G>T missense mutation in mttp). (C) Representative image of a trans-heterozygous mttpstl/c655 embryo; 3 dpf, scale = 500 μm. The dark/opaque yolk phenotype is present at expected ratios and genotyping confirms that only the embryos with opaque yolks are trans-heterozygous for the mttp alleles. (D) Depiction of the mttp gene structure highlighting the locations of the stl (L475P) (position 11431645 (GRCz10), transcript mtp-204 (ENSDART00000165753.2)) and c655 (G863V) missense alleles in exon 11 and 18, respectively. An additional SNV in mttp at position Chr1:11,421,300 GRCz10 (T>C) causing a missense mutation (M850T) was also identified in c655 mutants; however, this SNV was not predicted to be deleterious and has been previously noted in Ensembl.

The opaque yolk phenotype results from the accumulation of aberrant cytoplasmic lipid droplets in the yolk syncytial layer.

(A) (Top) Cartoon depicting the cross-sectional view of a 4 dpf zebrafish embryo. The YSL surrounds the yolk mass and serves as the embryonic digestive organ. The dashed box indicates the view expanded in the bottom panel and in panel B. (Bottom) Stored yolk lipids undergo lipolysis in yolk platelets (YP), presumably releasing free fatty acids into the YSL. These fatty acids are re-esterified in the ER bilayer to form TG, PL, and cholesterol esters. The lipids are packaged into B-lps in the ER with the help of Mtp and are likely further processed in the Golgi before being secreted into the perivitelline space (PS) and then circulation. (B) Representative transmission electron micrographs of the yolk and YSL from wild-type and mttp mutants; dashed lines delineate the YSL region, mt = mitochondria, scale = 10 μm. (C) Quantification of lipid droplet size in mttp mutants, n ≥ 700 lipid droplets in 2 fish per genotype; mean +/- SD. (D) Quantification of the number of lipid droplets per YSL area, n = 7–9 YSL regions per genotype (3–5 regions per fish, 2 fish per genotype); mean +/- SD, Kruskall-Wallis with Dunn’s Multiple Comparison test, vs. mttpc655/c655, * p < 0.05, *** p < 0.001.

The <italic>c655</italic> mutation supports secretion of small LDL-sized lipoproteins <italic>in vivo</italic>.

(A) LipoGlo fish express the NanoLuc luciferase enzyme as a C-terminal fusion on ApoBb.1 as a result of TALEN-based genomic engineering [48]. (B) LipoGlo signal (RLU: relative luminescence units) in WT, mttpstl/stl, and mttpc655/c655 fish throughout embryonic development (2–6 dpf). Results represent pooled data from 3 independent experiments, n = 22–34 fish/genotype/time-point. Significance was determined with a Robust ANOVA, Games-Howell post-hoc tests were performed to compare genotypes at each day of development, and p-values were adjusted to control for multiple comparisons, a = WT vs. mttpstl/stl, p < 0.001, b = mttpc655/c655 vs. mttpstl/stl, p < 0.001, c = WT vs. mttpc655/c655, p < 0.001, d = WT vs. mttpstl/stl, p < 0.05. (C) Representative whole-mount images of B-lp localization using LipoGlo chemiluminescent microscopy in WT, mttpstl/stl, and mttpc655/c655 fish throughout development; scale = 1 mm. Graphs represent pooled data from 3 independent experiments, n = 13–19 fish/genotype/time-point; mttpstl/stl had a significantly different ApoB localization from WT and mttpc655/c655, p < 0.001, Robust ANOVA. Games-Howell post-hoc analysis reveals statistical differences at all developmental stages; p < 0.05–0.001. (D) Representative LipoGlo PAGE gels and quantification of B-lp size distribution from whole embryo lysates during development. B-lps are divided into four classes based on mobility, including zero mobility (ZM) and three classes of serum B-lps (VLDL, IDL, and LDL). Graphs show subclass abundance for WT, mttpstl/stl, and mttpc655/c655 fish at each day of embryonic development as described in [48]. Results represent pooled data from n = 9 samples/genotype/time-point; at each particle class size, there were statistically significant differences between genotypes (Robust ANOVA, p < 0.001). Games-Howell post-hoc analysis revealed numerous differences between genotypes at each developmental stage, see S7 Fig. (E) Representative whole-mount images of LipoGlo microscopy and Oil Red O imaging in 15 dpf embryos chow-fed for 10 days and fasted ~18 h prior to fixation; scale = 1 mm. Livers (outlined) are magnified for clarity in insets on right. Results represent pooled data from 3 independent experiments, n = 15 fish/genotype/time-point.

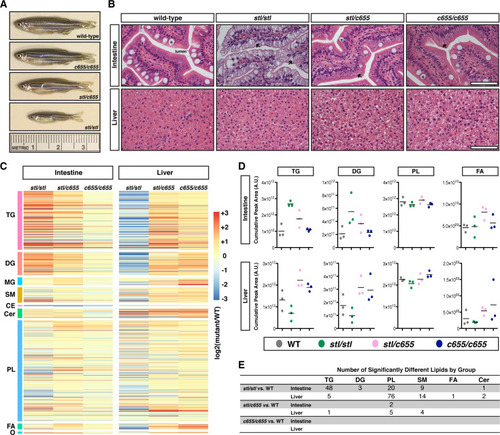
The <italic>stl</italic> and <italic>c655 mttp</italic> mutations have differential effects on growth and the accumulation of lipid in intestine and liver.

(A) Representative images of male WT and mttp mutant fish at 12 weeks of age. (B) Representative images of H&E stained intestine and liver from adult male WT and mttp mutant fish (7.5 mo), scale = 50 μm, * indicate goblet cells, arrows indicate representative lipid accumulation in enterocytes. (C–E) Intestine and liver tissue from adult male fish were extracted based on equal concentration of protein. Tissue lipid extracts from WT and mttp mutant fish were quantitated using an HPLC system coupled to a tandem mass spectrometer (LC-MS/MS) (n = 3; 1 fish per sample/genotype). (C) Heat maps represent fold-change from WT of over 1000 individual lipid species grouped into lipid classes (triacylglycerol [TG, n = 274], diacylglycerol [DG, n = 108], monoacylglycerol [MG, n = 36], sphingomyelin [SM, n = 72], cholesterol ester [CE, n = 7], ceramides [Cer, n = 44], phospholipid [PL, n = 472], free fatty acid [FA, n = 27] and other lipids [O; including sterols, sphingosine, sulfatide, zymosteryl and wax esters, n = 10]). (D) Quantification of total intestinal and liver TG, DG, PL, and FA from mutant lines as expressed as a sum of lipid group (n = 3). For additional lipid groups, see S11 Fig. (E) The number of individual lipid species data from panel (C) that are statistically different from WT (adj. p < 0.20).

The <italic>c655</italic> mutation disrupts TG transfer activity, but not PL transfer activity of the zebrafish Mtp complex.

(A, B) COS-7 cells were first transfected with an expression vector for human APOB48 (5 μg), distributed equally in 6-well plates, and subsequently transfected with plasmids expressing either wild-type zebrafish mttp-FLAG, mttpstl-FLAG, mttpc655-FLAG, or empty vector (pcDNA3) (3 μg). After 72 h, APOB48 was measured via ELISA in media (A) or in the cell (B). Data are representative of 7 independent experiments (each data point is the mean of three technical replicates), mean +/- SD, One-Way ANOVA with Bonferroni post-hoc tests, * p < 0.05, ** p < 0.01, *** p < 0.001. (C) Representative immunofluorescent staining using anti-FLAG (red) and anti-Calnexin (green) antibodies in COS-7 cells expressing wild-type or mutated mttp-FLAG constructs; scale = 25 μm. The percentage of cells expressing the FLAG-tagged proteins was similar among all groups (Mtp-FLAG 37%, stl-FLAG 31%, c655-FLAG 41% transfection efficiency). (D) Zebrafish Mtp-FLAG proteins (WT, stl and c655) were immunoprecipitated from COS-7 cell lysate (400 μg) using the M2 flag antibody and immunoblots were probed for both FLAG and PDI (Representative of 2 experiments). For input, 15 μg of cell lysate was used. (E) COS-7 cells were transfected with plasmids expressing pcDNA3, wild-type zebrafish mttp-FLAG, or mutant mttp-FLAG constructs. Cells were lysed and 60 μg of protein was used to measure the % TG transfer of nitrobenzoxadiazole (NBD)-labeled triolein from donor to acceptor vesicles after 45 min; n = 3 (each n is the mean of three technical replicates from independent experiments), mean +/- SD, One-way ANOVA with Bonferroni post-hoc tests, *** p < 0.001. (F) Wild-type and mutant Mtp proteins were purified using anti-FLAG antibodies and used to measure the % transfer of NBD-labeled phosphoethanolamine triethylammonium from donor to acceptor vesicles after 180 min; n = 3 (each n is the mean of three technical replicates from independent experiments), mean +/- SD, randomized block ANOVA with Bonferroni post-hoc tests, *** p < 0.001.

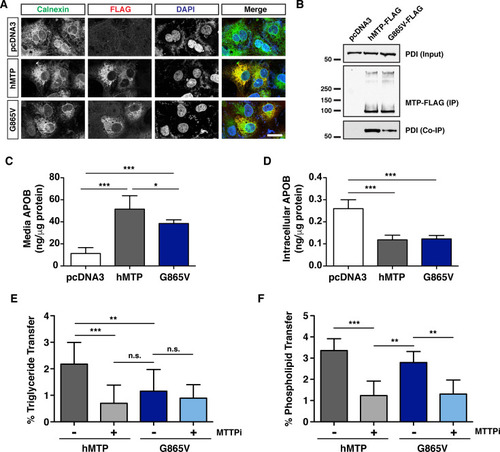
The corresponding <italic>c655</italic> mutation in human MTTP disrupts TG transfer but not PL transfer activity.

(A) Immunofluorescence in COS-7 cells expressing wild-type human MTTP-FLAG or human MTTP(G865V)-FLAG proteins using anti-FLAG (red) and anti-Calnexin (green) antibodies; scale = 25 μm. (B) Human MTP-FLAG proteins (WT and G865V) were immunoprecipitated from COS-7 cell lysate (400 μg protein) using the M2 flag antibody and immunoblots were probed for both FLAG and PDI. For input, 15 μg protein was used. (C, D) COS-7 cells were co-transfected with human APOB48 and either wild-type human MTTP-FLAG, MTTP(G865V)-FLAG or empty pcDNA3 plasmids. After 72 h, APOB48 was measured via ELISA in media (C) or in the cell (D). Data are representative of 7 independent experiments (each data point is the mean of three technical replicates), pcDNA3 control data is re-graphed from Fig 5A & 5B (data for Figs 5A, 5B, 6C and 6D were generated together); mean +/- SD, One-Way ANOVA with Bonferroni post-hoc tests, * p < 0.05, *** p < 0.001. (E) COS-7 cells were transfected with plasmids expressing human wild-type or MTTP(G865V)-FLAG constructs. Cells were lysed and 60 μg of protein was used to measure TG transfer activity in the presence or absence of the MTP inhibitor lomitapide (MTTPi, 1 μM) (% after 45 min); n = 3 (each n is the mean of three technical replicates from independent experiments), mean +/- SD, One-way ANOVA with Bonferroni post-hoc tests, ** p < 0.01, ***p < 0.001, n.s. not significant). (F) Wild-type and mutant MTP proteins were purified using anti-FLAG antibodies and used to measure PL transfer in the presence or absence of lomitapide (MTTPi, 1 μM) (180 min); n = 3 (each n is the mean of three technical replicates from independent experiments), mean +/- SD, randomized block ANOVA with Bonferroni post-hoc tests, ** p < 0.01, ***p < 0.001.

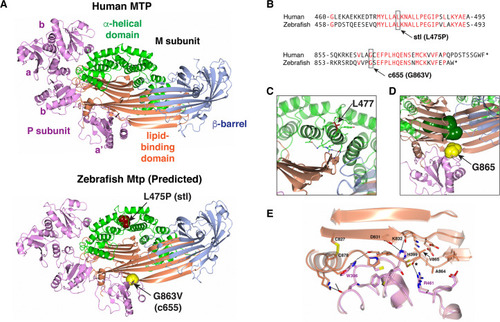
Structural analysis of MTP mutations.

(A) Ribbon representation of the human MTP complex (PDB entry 6I7S) and the Zebrafish modeled structure. The positions of L475 and G863 in the Zebrafish structure are shown in space-filling representation. (B) Alignment of human MTP and zebrafish Mtp amino acid sequences surrounding the stl and c655 mutations. (C) Close-up view of the area surrounding L477 in the human MTP complex. The position of L477 (red) is highlighted. The conserved hydrogen bonds linking the helical domain to the tip of the C-sheet of the lipid-binding domain are shown as well as amino acids within 4Å of L477. (D) Close-up view of the area surrounding G865 in the human MTP complex. The position of G865 (yellow) and the PEG molecule (dark green) which occupies the lipid-binding site in the solved structure are shown in space-filling representation. The a’ domain of PDI (pink) in the complex occludes the lipid entry/exit site. (E) Close-up view showing the outer strand displacement in sheet A of the lipid-binding domain of the M subunit resulting from the G865V mutation. Asterisk indicates the wild-type backbone carbonyl of G865 hydrogen bonded to R461 of PDI. Panels C–E are colored as in panel A.

Acknowledgments
This image is the copyrighted work of the attributed author or publisher, and ZFIN has permission only to display this image to its users. Additional permissions should be obtained from the applicable author or publisher of the image. Full text @ PLoS Genet.