FIGURE SUMMARY
Title

Genetic Deletion of Zebrafish Rab28 Causes Defective Outer Segment Shedding, but Not Retinal Degeneration

Authors
Carter, S.P., Moran, A.L., Matallanas, D., McManus, G.J., Blacque, O.E., Kennedy, B.N.
Source
Full text @ Front Cell Dev Biol

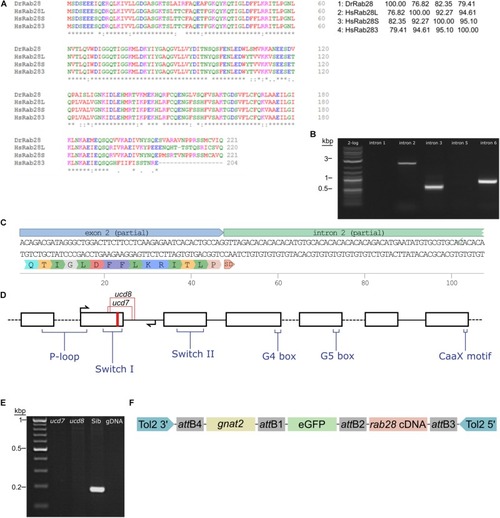
Sequencing of the zebrafish rab28 gene, CRISPR mutagenesis and Tol2 transgenesis. (A) Multiple sequence alignment of zebrafish Rab28 protein sequence, predicted from mRNA, with that of the three known human RAB28 protein isoforms. The percentage protein identity is shown in a matrix table. (B) Representative gel showing PCR amplification of predicted rab28 introns 2, 3, and 6. (C) DNA sequencing reveals the exon–intron boundary at exon 2 of zebrafish rab28 and the predicted translated sequence encoded by exon 2. SD: splice-donor site. (D) Schematic of predicted rab28 gene structure. Black boxes represent exons and connecting lines represent introns. Red stripe indicates location of sgRNA target site used to generate CRISPR mutants, arrows indicate genotyping primer positions, coding positions for critical Rab GTPase motifs are highlighted and the location of ucd7 and ucd8 indels indicated. (E) Example RT-PCR gel showing the absence of correctly spliced rab28 cDNA between exons 2 and 4 in homozygous ucd7 and ucd8 larvae, which is present in WT siblings. (F) Schematic of the construct used to generate eGFP-Rab28 transgenic zebrafish. Expression is driven by the gnat2 (cone transducin alpha) promoter (yellow box). att: Gateway att sites, Tol2 3′ and 5′: transposon inverted repeats.

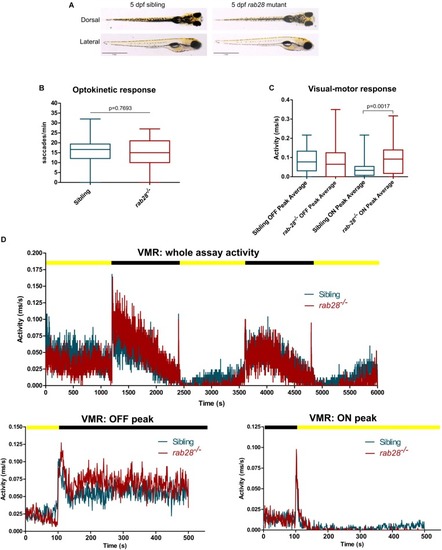
rab28 knockout zebrafish have subtle defects in visual behavior at 5 dpf. (A) Representative images of rab28 knockout and sibling zebrafish larvae at 5 dpf. Gross morphology is indistinguishable between knockouts and siblings. (B) Box and whisker plot of the optokinetic response (OKR) of rab28 knockout larvae versus sibling larvae at 5 dpf. OKRs are not significantly different. Box extremities represent 1st and 3rd quartiles; whiskers are maximum and minimum values. p-Value derived from unpaired t-test. OKR data are from 32 mutants and 98 siblings, across three experimental replicates. (C) Box and whisker plot of 5 dpf larval activity during the visual-motor response (VMR) assay. OFF peak activity is identical between rab28 knockouts and siblings, albeit rab28 knockouts have an average 51% higher ON peak activity. Data are from three independent replicates and are the average of 5 s of activity following light changes. Box extremities represent 1st and 3rd quartiles; whiskers are maximum and minimum values. p-Value derived from unpaired t-test. (D) Activity traces showing 5 dpf larval activity over the course of an entire VMR assay (100 min), as well as separate graphs showing activity 100 s before and 400 s after OFF and ON peaks, respectively. Black and yellow bars indicate dark and light conditions, respectively. VMR data are from 32 mutants and 49 siblings, across three experimental replicates.

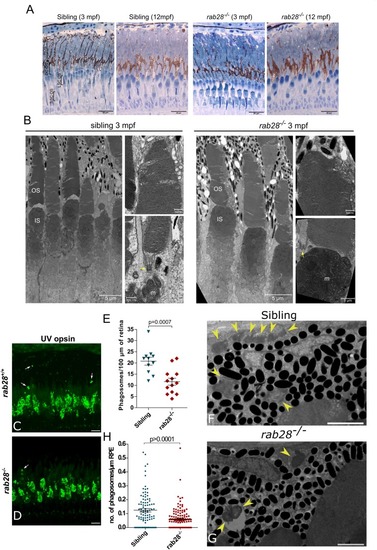
rab28 knockout zebrafish have reduced outer segment shedding, but normal retinal histology and ultrastructure. (A) Representative images of retinal histology in 3 and 12 mpf zebrafish, showing views of the photoreceptor layer in the central and peripheral retina in rab28ucd8 mutants and siblings. The overall structure and composition of the photoreceptor layer is grossly normal in both. Scale bars 20 μm (B) Representative transmission electron micrographs of 3 mpf zebrafish rab28ucd7 knockout and sibling retinas. Low magnification images show several cone photoreceptors, while high magnification images show examples of OS base and tips. Yellow arrows indicate ciliary basal body. OS: outer segment; IS: inner segment; m: mitochondria. Low magnification image scale bars 5 μm, high magnification scale bars 500 nm. (C,D) Confocal z-projections of rab28 mutant and sibling control retinas at 1 mpf, stained for UV opsin to label phagosomes (white arrows). Samples were collected 4 h after lights on. Scale bars 10 μm (E) Scatter plots of phagosome density in rab28 mutant and sibling retinas. Data are derived cryosections immunostained for UV and red opsins and cone transducin α. p-Value is derived from t-test. Error bars show SEM. Data are from 13 and 11 retinal z-projections from at least three individuals for mutants and siblings, respectively. (F,G) Representative TEM of RPE phagosomes in 15 dpf rab28 mutants and sibling controls. Yellow arrows indicate phagosomes. Samples were collected 4 h after lights on. Scale bars 2 μm. (H) Scatter plots of phagosome density in 15 dpf rab28 mutant and sibling retinas, derived from TEM. p-Value is derived from t-test. Error bars show SEM. Data are from three sibling and three mutant individuals.

eGFP-Rab28 localization to larval zebrafish cone outer segments is partially dependent on GTP/GDP-binding. (A–C) Representative confocal z-projections of eGFP-Rab28 localization in 5 dpf zebrafish cone photoreceptors. The WT, putative GTP-preferring (Q72L) and GDP-preferring (T26N) variants of Rab28 all localize strongly to the outer segments of zebrafish cones, co-localizing with UV opsin labeling. Scale bars 5 μm. For WT, Q72L and T26N eGFP-Rab28 reporters a total of 14, 24 and 25 larvae were imaged, respectively. (D) Box and whisker plots of the ratio of eGFP-Rab28 intensity in the OS vs. synaptic region of larval cones. Box extremities represent 1st and 3rd quartiles; whiskers are maximum and minimum values. Data are from 60 cones per transgenic line. One-way ANOVA p-value < 0.0001. (E,F) Deconvolved, high resolution confocal z-projections of eGFP-Rab28 Q72L and T26N mutant localization in cones of 5 dpf larvae. A discrete localization pattern of the T26N mutant in COS is clearly observed (white arrowheads). Scale bars 4 μm.

eGFP-Rab28 localization in 1 mpf zebrafish cone photoreceptors. (A–C) Representative confocal z-projections of eGFP-Rab28 localization in 1 mpf zebrafish cones. Cone OS are stained with anti-cone transducin alpha antibody. Each tier of photoreceptors is comprised of different classes of cone. DC: double cones; LSC: long single cones; SSC: short single cones. Scale bars 10 μm. For WT, Q72L and T26N eGFP-Rab28 reporters a total of 13, 11 and 11 retinas across at least six individuals were imaged, respectively. (D–F) Deconvolved, high resolution confocal z-projections of eGFP-Rab28 WT, Q72L and T26N mutant localization in 1 mpf cones. Arrowheads point to discrete bands present throughout the OS. Scale bars 5 μm.

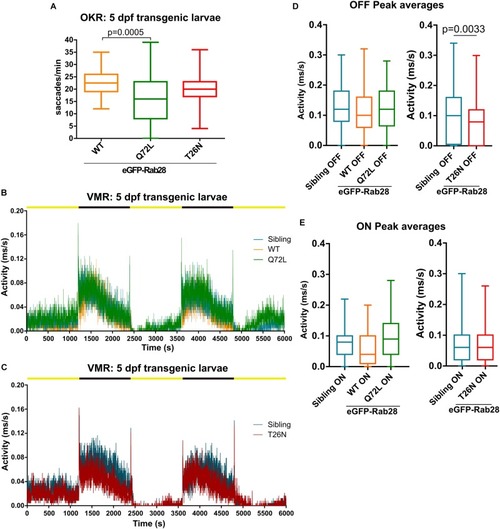
Rab28 transgenic zebrafish have mild to moderate visual defects at 5 dpf. (A) Box and whisker plot of optokinetic response (OKR) assay of 5 dpf larvae overexpressing GFP-Rab28 WT, Q72L (GTP-preferring) or T26N (GDP-preferring). Larvae expressing the Q72L variant display greater variability and an overall reduction in OKR scores. Box extremities represent 1st and 3rd quartiles; whiskers are maximum and minimum values. Data are from three independent replicates; at least 30 larvae analyzed per strain over three experimental replicates; p-value derived from one-way ANOVA. (B,C) Representative activity traces of 5 dpf transgenic and sibling larval activity over the course of the entire VMR assay. Black and yellow bars indicate dark and light conditions, respectively. (D,E) Box and whisker plots of the OFF and ON peak activity of 5 dpf transgenic and sibling larvae. Data are from three independent replicates and are the average of 5 s of activity following light changes. At least 64 larvae were analyzed per strain. p-Value derived from unpaired t-test (D).

Rab28 transgenic zebrafish have normal retinal ultrastructure and normal outer segment shedding. (A) Representative TEM of 7 mpf eGFP-Rab28 transgenic zebrafish. Low magnification images show rows of several cone photoreceptors, while high magnification images show examples of OS tips. Low magnification scale bars 5 μm, high magnification scale bars 500 nm. (B–D) Confocal z-projections of 1 mpf retinas of zebrafish expressing eGFP-Rab28 (WT, Q72L, or T26N variants). Phagosomes, labeled with eGFP, are indicated by white arrows. Samples were collected 4 h after lights on. Scale bars 10 μm. (E) Scatter plots showing normalized phagosome density in the retinas eGFP-Rab28 transgenic zebrafish. Data are derived from cryosections in which eGFP was used to identify phagosomes. p-Value derived from one-way ANOVA. Error bars show SEM. Data are from 17, 17, and 13 retinal z-projections from at least three individuals for WT, Q72L, and T26N variants, respectively.

Rab28 interacts with multiple phototransduction proteins in the zebrafish eye. (A) Schematic of experimental workflow for Co-IP/MS of eGFP-Rab28 (B) Western blotting with an anti-GFP antibody, showing eGFP-Rab28 in whole eye lysate and elute after immunoprecipitation with anti-GFP beads. An untagged eGFP only control is also shown. (C) Venn diagram showing the number and overlap of significantly enriched (vs. GFP-only control) interacting proteins identified for each variant. (D) Pie charts showing gene ontology terms for proteins identified by mass-spectrometry following co-immunoprecipitation, which demonstrate a statistically significant interaction with any of the three variants. (E) Western blot of whole adult zebrafish eye lysate with an anti-PDE6D antibody, before and after IP of eGFP-Rab28. PDE6D band at 15 kDa mark (PDE6D mass: 17.4 kDa). Extra bands in the lysates are either post-translationally modified PDE6D, degradation products or non-specific binding by the antibody. IPs either received no treatment, GTPγS or GDP. eGFP only control is also shown.

Acknowledgments
This image is the copyrighted work of the attributed author or publisher, and ZFIN has permission only to display this image to its users. Additional permissions should be obtained from the applicable author or publisher of the image. Full text @ Front Cell Dev Biol