FIGURE SUMMARY
Title

The peptide transporter 1a of the zebrafish Danio rerio, an emerging model in nutrigenomics and nutrition research: molecular characterization, functional properties, and expression analysis

Authors
Vacca, F., Barca, A., Gomes, A.S., Mazzei, A., Piccinni, B., Cinquetti, R., Del Vecchio, G., Romano, A., Rønnestad, I., Bossi, E., Verri, T.
Source
Full text @ Genes Nutr

Pairwise alignment between zebrafish PepT1a (Slc15a1a) and PepT1b (Slc15a1b) amino acid sequences obtained by using Clustal Omega and edited using GeneDoc 2.7 software. The predicted conserved PTR2 family proton/oligopeptide symporter signatures (in zebrafish PepT1a, motif 1—PROSITE pattern PS01022—amino acid residues 80–104; and motif 2—PROSITE pattern PS01023—amino acid residues 173–185) are colored in red. In the amino acid sequence, putative transmembrane domains are named I to XII. Weak predicted transmembrane domains (in zebrafish PepT1a, transmembrane domains VIII and X) are colored in gray

Transport activity and pH dependence of zebrafish PepT1a (Slc15a1a) and PepT1b (Slc15a1b). a Representative traces of transport currents in zebrafish PepT1a (zfPepT1a, top) and zebrafish PepT1b (zfPepT1b, bottom) heterologously expressed in Xenopus laevis oocytes. The currents in the presence of the substrates (1 mmol/L), indicated by bars, were recorded at the holding potential of − 60 mV and at pH 6.5 (left), 7.6 (middle), and pH 8.5 (right). b Transport-associated currents elicited by 1 mmol/L Gly-Gln (GQ) (left), Ala-Ala (AA) (middle), and Gly-Gly-Gly (GGG) (right) at − 60 mV at pH 6.5 (green), 7.6 (blue), and 8.5 (orange). Current values, shown in the histograms as the differences of the current recorded in the presence of the substrate and that in its absence, are reported as means ± SEM from 5 oocytes from 1 batch (one-way ANOVA test; *P < 0.05, **P < 0.01, and ***P < 0.001)

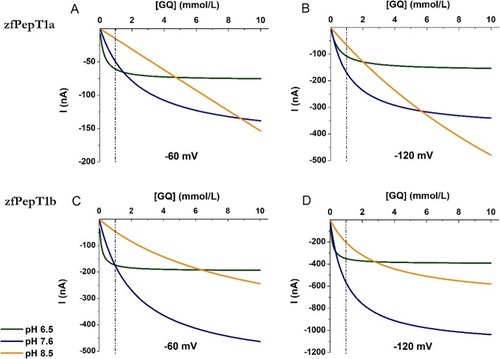
Fitting of the Gly-Gln (GQ) transport-associated currents as a function of substrate concentration (from 0.01 to 10 mmol/L) at different pH (pH 6.5 in green, pH 7.6 in blue, and pH 8.5 in orange) for two different membrane potentials: − 60 mV (left) and − 120 mV (right). a, b Zebrafish PepT1a (zfPepT1a). c, d Zebrafish PepT1b (zfPepT1b). The dashed line indicates 1 mmol/L Gly-Gln concentration

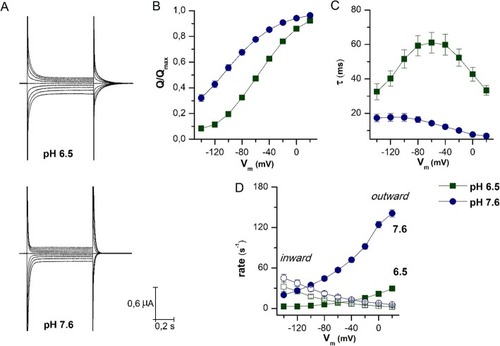
Biophysical parameters of PepT1a. a Representative trace of current elicited by voltage pulses in the range − 140 to + 20 mV (20 mV steps from Vh = − 60 mV) in the absence of substrate at pH 6.5 and pH 7.6 as indicated. bd Analysis of pre-steady-state currents at pH 6.5 (green square) and 7.6 (blue circle) obtained from the slow component of a double exponential fitting of the corresponding traces in the absence of the substrate. b Charge/voltage (Q/V) curves obtained by integration of the pre-steady-state isolated at the two pH values. c Time constant/voltage (τ/V) relation; the values were estimated from the on transients, except at − 60 mV (Vh), which was estimated from the off transients. d Unidirectional rate constants, inward (open symbols) and outward (solid symbols), of the intramembrane charge movement in function of different tested voltage conditions, derived from the τ/V relationship and the Q/V relationship at two pH conditions. Data are mean ± SEM from 10 oocytes of 3 different batches. Vh, holding potential

Expression analysis by RT-PCR on pept1a (slc15a1a) mRNA in adult zebrafish tissues. a RT-PCR assay on cDNA templates from total RNA extracted from various tissues; a PCR product of ~ 350 bp related to pept1a (slc15a1a) mRNA is present in samples from the intestine and ovary, while it is absent in the eye, gills, kidney, spleen, liver, pancreas, and brain; using the same cDNA templates, a PCR product of ~ 440 bp related to the actb mRNA is present in all tissue samples; L: 1 Kb Plus DNA ladder (Thermo Fisher Scientific). b Comparative table of pept1a (slc15a1a) vs. pept1b (slc15a1b) mRNA presence in the different zebrafish tissues analyzed. pept1b (slc15a1b) tissue expression data are from [14]. +, positive detection; n.d., not detected; n.i., not investigated

EXPRESSION / LABELING:
Genes:
Fish:
Anatomical Terms:
Stage: Adult

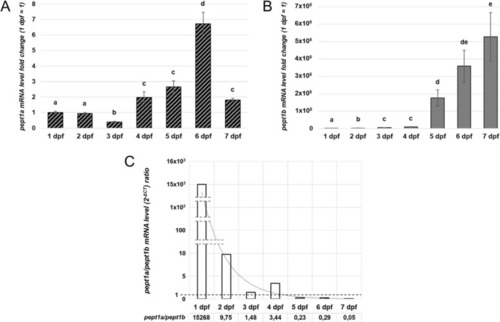
Quantitative expression analysis of zebrafish pept1a (slc15a1a) and pept1b (slc15a1b) mRNAs during early development. a mRNA expression analysis by qPCR in zebrafish embryos/larvae from 1 to 7 days post-fertilization (dpf). The levels of pept1a (slc15a1a) mRNA were calculated as 2-ΔCT mean values obtained from two rounds of qPCR assays for each of three independent biological replicates (pools of 10–15 embryos/larvae), and then they were expressed as fold-change (y-axis) with respect to the 1 dpf stage taken as control value (1 dpf = 1). b mRNA expression analysis by qPCR of the pept1b (slc15a1b) gene in zebrafish embryos and larvae from 1 to 7 dpf. Statistical analysis of variance of the means was assessed by one-way ANOVA and Tukey's post hoc test. In histograms, different letters indicate statistically different values (n = 3 independent biological replicates; P < 0.05). c Representation of the trend of the pept1a/pept1b mRNA level ratio at 1 to 7 dpf, based on the 2-ΔCT mean values obtained from the output data deriving from qPCR assays performed, with the same primer efficiency values, for both the pept1a- and pept1b-specific primer pairs

EXPRESSION / LABELING:
Genes:
Fish:
Anatomical Term:
Stage Range: Prim-5 to Days 7-13
Acknowledgments
This image is the copyrighted work of the attributed author or publisher, and ZFIN has permission only to display this image to its users. Additional permissions should be obtained from the applicable author or publisher of the image. Full text @ Genes Nutr