FIGURE SUMMARY
Title

Endothelial CDS2 deficiency causes VEGFA-mediated vascular regression and tumor inhibition

Authors
Zhao, W., Cao, L., Ying, H., Zhang, W., Li, D., Zhu, X., Xue, W., Wu, S., Cao, M., Fu, C., Qi, H., Hao, Y., Tang, Y.C., Qin, J., Zhong, T.P., Lin, X., Yu, L., Li, X., Li, L., Wu, D., Pan, W.
Source
Full text @ Cell Res.

VEGFA induces vessel regression in cds2-deficient zebrafish. a Diagram of zebrafish cds2 mutant allele cas008 (cds2cas008). b Quantification of classified vascular phenotypes in cds2 mutant embryos at 36 hpf. The right panel shows the representative images of weak, medium and severe vascular defects in cds2 mutant embryos within Tg(fli1a:eGFP) transgenic background. The counted embryo number is shown on the top of bar graph. c Relative vegfa expression in 36 hpf WT and cds2 mutant embryos within two phenotypic subtypes. n= 10 samples per group, 10 embryos pooled for each sample. d Confocal images of trunk vessels from 36 and 84 hpf WT and cds2 mutant embryos injected with VEGFA protein or PBS. White lines indicate the dorsal position where ISVs in WT embryos can reach. The top panel represents timing for venous microinjection (CCV) and confocal imaging analysis. e Quantification of vascular deficiency in the embryos (Fig. S1e) at 84 hpf. Bars show percentage of classified ISVs that have grown to the dorsal trunk (Normal), to the myoseptum (Medium) or regressed to the axial vessels (Severe). Representative images for 3 classified phenotypes are shown on the right. The counted ISV number from 20–25 embryos per group (10 trunk segments counted per embryo) is shown on the top bar graph. DLAV, dorsal longitudinal anastomotic vessel. f Quantitative analysis of trunk vessels in WT and cds2 MO-injected embryos with or w/o vegfa OE. The quantified ISV number shown on the top graph is from 20–25 embryos per group. N, normal; M, medium; S, severe. g Time-lapse imaging analysis on cds2 mutants with Tg(fli1a:eGFP) transgenic background and vegfa OE during 52–72 hpf, showing ISV regression process. h, i Time-lapse phenotype analysis on vessel regression events under different heat shock initiation time points (h, embryos were heat-shocked for 1 h at 28, 32 or 36 hpf, n = 300 ISVs counted from 30 embryos) and various heat shock durations (i, n = 300 ISVs counted from 30 embryos). j Relative vegfa expression of Tg(hsp:vegfaa) embryos challenged with different heat shock durations. vegfa level was determined at 2–4 h after heat shock induction and normalized to wild type embryos under the same experimental conditions. n = 4 samples per group, 20 embryos pooled for each sample. Scale bars, 50 μm (b and d; 36 hpf), 70 μm (d; 84 hpf), 100 μm (e) and 20 μm (g). Error bars, mean ± SEM. Statistical significance between the indicated sample versus WT is ****P < 0.0001 or ns, not significant (P ≥ 0.05). See also Supplementary information, Fig. S1

Vessel regression in CDS2 endothelium-specific knockout mice. a Model of tamoxifen treatment on mouse pups. Confocal images of isolectin B4 (IB4) (b) and IB4/Collagen IV (COL4) (c) double stained retinal vessels at postnatal day (P) 7 in Cds2iΔEC or control mice with or w/o VEGFA injection. Asterisks display the blunt angiogenic front. Arrows indicate COL4+/IB4 empty sleeves. d Bar graphs showing analysis of angiogenic sprouts, COL4+/IB4 empty sleeves, endothelial area and vascular branch points. n = 6–10 mice per group. Inactivation of Cds2 caused retardation of B16 tumor growth (e), necrosis (f; left panels, day11 tumors), blood vessel (f; right panels and g) and tumor weight (h) reduction. Schematic diagram (e) shows the strategy to inactivate Cds2 after tumor cell implantation. n = 6–8 tumors from 6–8 mice per group. Anti-COL4 and anti-CD31 co-immunostaining (i) and quantitative analysis (j) on B16 tumors from control or Cds2iΔEC mice at 13 days post-implantation. Arrows indicate regressed vessels. n = 6 tumors from 6 mice as a group. k Quantification of Vegfa mRNA level in day 9 B16 tumors. n = 8 tumors from 4 mice per group. l Model of VEGFA dose-dependent tumor vessel regression in CDS2-deficient endothelium. Left panel shows that increased angiogenesis associates with increased tumor growth in WT mice. Right panel depicts that vessel regression occurs in CDS2-deficient vessels, associated with high level of VEGFA produced by tumor, which in turn further advances vessel regression and blocks tumor progression. Scale bars, 200 μm (b and f; right panel), 70 μm (c), 0.5 cm (f; left panel) and 100 μm (i). Error bars, mean ± SEM. Statistical significance between the indicated sample versus control or between the marked pairs are *P < 0.05, **P < 0.01, ***P < 0.001, ****P < 0.0001, or ns, not significant (P ≥ 0.05). See also Supplementary information, Figs. S2S5

PI-PIPs metabolism is involved in CDS2-deficient vessel regression. a Schematic diagram of CDS2-controlled phosphoinositide recycling. DAG, diacylglycerol; PA, phosphatidic acid; PIS1, phosphatidylinositol synthase 1; PI, phosphoinositol; PIK, phosphoinositol 3/4/5-kinase; PIPK, phosphatidylinositol 4/5-phosphate 5/4-kinase; PTEN, phosphatase and tensin homolog; PI3K, phosphoinositide 3 kinase; PLC, phospholipase c; PG, phosphatidylglycerol; CL, cardiolipin. b Model of timing for phospholipid-carrier mixture microinjection, heatshock induction and confocal imaging analysis in (c) and (d). c Quantification of rescue effects of different phospholipids (PI, PG, PIP2 and PIP3) on vegfa OE-induced ISV regression in cds2 mutant embryos. Bars show percentages of vessel deficiency. The representative images of classified vascular phenotype are shown on the right. The counted ISV numbers were shown on the top, 10 ISV per embryo. d Representative images of trunk vessels from cds2 mutants at 76–80 hpf with or w/o vegfa OE and with microinjection of lipid–carrier complex, including PG, PI, PIP2 or PIP3 at 28–30 hpf. Scale bars, 50 μm (c) and 100 μm (d)

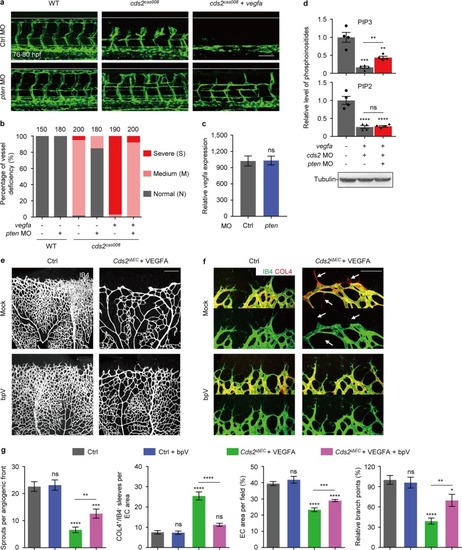
PIP3 exhaustion governs VEGFA-induced regression of CDS2-deficient endothelium. Confocal images (a) and quantitative analysis (b) of vessel-deficient phenotype in WT zebrafish embryos or cds2 mutants with or w/o vegfa OE, with control MO or pten MO (combination of ptena and ptenb MO) injection. The counted ISV number shown on the top (b) is from 15–20 embryos per group. c Relative vegfa mRNA level of cds2 mutants with vegfa OE injected with ctrl or pten MO. The expression was normalized to WT embryos. n = 3 samples per group, 15–20 embryos pooled for each sample. dpten knockdown partially restored PIP3, but not PIP2 level in cds2-deficient endothelium with vegfa OE. Western blotting analysis on a-Tubulin serves as the internal control for cell amounts in each sample collected during lipid quantitation analysis. n = 4 samples each group. Confocal images (e and f) and quantitative analysis (g) of P7 retinal vessels stained by IB4 (e) and IB4/COL4 (f) from control or VEGFA-injected Cds2iΔEC mice treated with bpV (PTEN inhibitor) or vehicle (saline). bpV (2 mg kg−1) or vehicle was given three times at P2, P4 and P6. Arrows show regressed vessels. Angiogenic sprouts, COL4+/IB4 empty sleeves, endothelial area and branch points were quantified in (g), n = 6–10 mice per group. Scale bars, 100 μm (a and f) and 200 μm (e). Error bars, mean ± SEM. *P < 0.05; **P < 0.01; ***P < 0.001; ****P < 0.0001; ns, not significant (P ≥ 0.05). See also Supplementary information, Fig. S6

FOXO1 activation is required for VEGFA-induced vessel regression in mouse retina model. a Schematic diagram showing nucleus FOXO1 distribution in retinal vasculature. In WT, nucleus FOXO1 mainly locate in remodeling endothelial plexus, however they are gathering to the angiogenic front of CDS2-deficient endothelium, which could be further increased by excessive VEGFA stimulation. IB4 and FOXO1 co-immunostaining (b) and quantitative analysis (c) on P7 retinas in control and Cds2iΔEC mice with or w/o recombinant VEGFA stimulation. Yellow arrows indicate nuclear localization of FOXO1. n = 8 mice per group. d Quantification of IB4 and FOXO1 co-staining of P7 retinal vessels in the remodeling plexus area from WT or Cds2iΔEC embryos with or without ectopic VEGFA injection. n = 5–8 mice per group. Confocal imaging analysis of P7 retinal vessels stained by IB4 (e) and IB4/COL4 (f) from control or VEGFA-injected Cds2iΔEC mice treated with AS1842856 (FOXO1 inhibitor) or vehicle. Arrows show regressed vessels. g Quantitative analysis on endothelial area, branch points, angiogenic sprouts and COL4+/IB4 empty sleeves of P7 retinal vessels in control and VEGFA-injected Cds2iΔEC mice with or without AS1842856 treatment. n = 6–10 mice per group. Scale bars, 50 μm (b; left panel), 25 μm (b; magnification figure), 200 μm (e) and 100 μm (f). Error bars, mean ± SEM. *P < 0.05; **P < 0.01 ***P < 0.001; ****P < 0.0001; ns, not significant (P ≥ 0.05). See also Supplementary information, Fig. S7

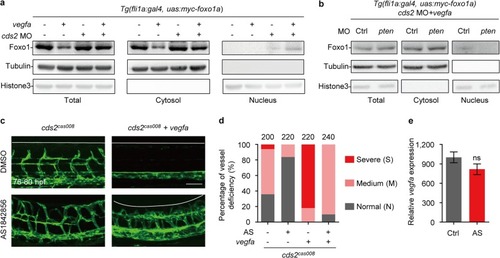
FOXO1 activation is required for VEGFA-induced regression in zebrafish cds2 mutants. a Western blotting analysis shows that Foxo1a translocates to the nuclei in cds2-deficient zebrafish endothelium upon VEGFA stimulation. Protein samples for whole embryos or cytosol/nucleus fractions were collected at 48 hpf from Tg(fli1a:gal4) embryos with Tol2 transposase-mediated Tg(uas:myc-foxo1a) transgenesis, with or w/o cds2 MO and with or w/o vegfa OE (heat-shock induction at 28 hpf) as indicated in the figure. b Western blotting analysis shows that pten knockdown blocks Foxo1a nuclear accumulation in cds2-deficient zebrafish endothelium with vegfa OE. Protein samples for total/cytosol/nucleus fractions were collected at 48 hpf from cds2 MO-injected Tg(fli1a:gal4) embryos with Tol2 transposase-mediated Tg(uas:myc-foxo1a) transgenesis and vegfa OE, with or w/o pten MO. Representative images (c) and phenotype quantitative analysis (d) of trunk vessels in cds2 mutant embryos with or w/o vegfa OE (heat-shock induction at 28 hpf) and with or w/o AS1842856 treatment (from 24 hpf) at 76–80 hpf. AS, AS1842856. The ISV number quantified on the top (d) is from 20–24 embryos per group. e Relative vegfa mRNA level in cds2 mutants with heatshock-induced vegfa OE, treated with DMSO or AS. The vegfa expression level was determined at 2 h post heat shock induction and normalized to WT embryos without vegfa OE. Ctrl, DMSO; AS, AS1842856. n = 3 samples, 20 embryos pooled for each sample. Scale bar, 100 μm. Error bar, mean ± SEM. ns, not significant (P ≥ 0.05)

PIP3 reduction is mainly caused by PLCγ mediated PIP2 hydrolysis. Representative confocal images (a) and quantitative analysis (b) of trunk vessel phenotypes of WT or cds2 mutant embryos with vegfa OE and with or w/o plcg1 MO. The ISV number counted from 20–22 embryos per group is shown on the top (b). c Relative vegfa mRNA level of cds2 mutants with vegfa OE injected with ctrl or plcg1 MO. vegfa expression level was determined at 2 h post heatshock induction and normalized to WT embryos without vegfa OE. n = 3 samples, 15–20 embryos pooled for each sample. dplcg1 knockdown partially restored PIP2 and PIP3 level in cds2-deficient endothelium with vegfa OE. Western blotting analysis on a-Tubulin serves as the internal control for cell amounts in each sample collected during lipid quantitation analysis. n = 4 samples per group. e Working model of VEGFA-triggered vessel regression on CDS2-deficient endothelium. The outcome of VEGFA signaling can be reversed from angiogenesis to vessel regression, which is dependent on CDS2-controlled PIP2 and PIP3 availability and FOXO1 signaling activation. Scale bar, 100 μm. Error bars, mean ± SEM. *P < 0.05; **P < 0.01; ***P < 0.001; ****P < 0.0001; ns, not significant (P ≥ 0.05). See also Supplementary information, Fig. S8

ZFIN is incorporating published figure images and captions as part of an ongoing project. Figures from some publications have not yet been curated, or are not available for display because of copyright restrictions.

EXPRESSION / LABELING:
Genes:
Fish:
Anatomical Term:
Stage: Prim-25
PHENOTYPE:
Fish:
Observed In:
Stage: Prim-25
Acknowledgments
This image is the copyrighted work of the attributed author or publisher, and ZFIN has permission only to display this image to its users. Additional permissions should be obtained from the applicable author or publisher of the image. Full text @ Cell Res.