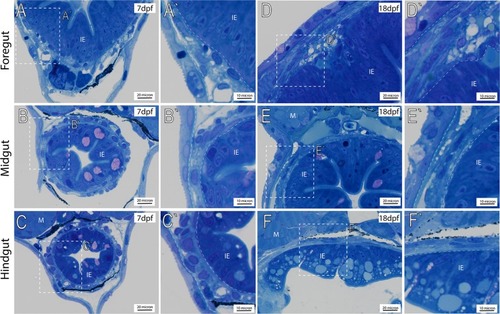
Transverse histological sections depict general anatomy of intestinal muscularis. Plastic embedded fish sectioned transversely and stained with toluidine blue at (AC′) 7 dpf, and 18 dpf (DF′), reveals the intestinal epithelium (IE) situated below trunk muscle (M). White-dashed box (AF) corresponds to higher magnification panels (A′–F′) where intestinal muscularis is shown (dashed lines).

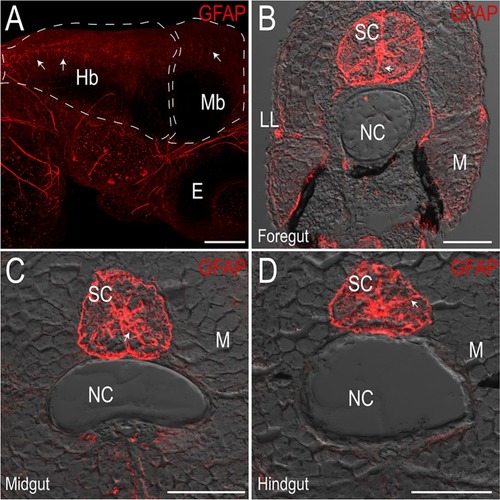
Zebrafish-specific Glial Fibrillary Acidic Protein (GFAP) antibody marks glia in the central nervous system. Maximum intensity projection confocal stack in (A) whole-mount immunofluorescence preparation of a 3 dpf larval fish showing GFAP+ cells in the hindbrain (Hb) and midbrain (Mb), scale bar: 100 microns, E: eye. (BD) Maximum intensity projections of transverse cryosections of 18 dpf larvae at the level of the foregut (B), midgut (C) and hindgut (D) mark radial glia throughout the spinal cord (SC). LL: lateral line, NC: notochord, M: skeletal trunk muscle, scale bar: 50 microns.

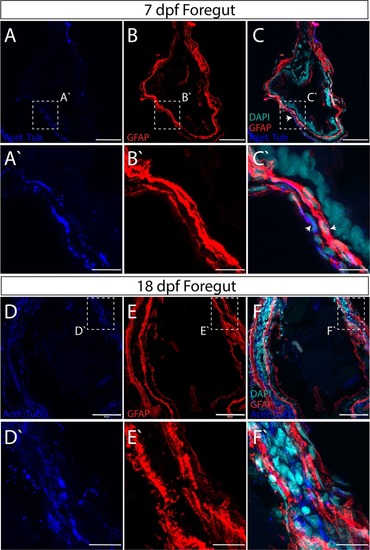
Axon and glial cell patterning within the myenteric plexus of the larval zebrafish foregut. Maximum intensity confocal projections of transverse cryosections indicate GFAP+ (red), Acetylated Tubulin+ (Acet-Tub) projections (blue) in the foregut of 7 dpf larvae (AC), where Acet-Tub+ processes form in an outer layer (white arrowheads), scale bar: 40 microns, (DF) 18 dpf larvae, scale bar: 50 microns. Nuclei revealed by DAPI (cyan). White-dashed box corresponds to region of magnification (A′–C′) scale bar: 10 microns, and (D′–F′) scale bar: 12.5 microns.

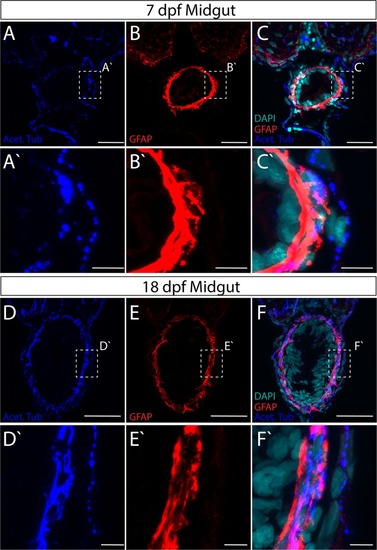
Axon and glial cell patterning within the myenteric plexus of the larval zebrafish midgut. Maximum intensity confocal projections of transverse cryosections indicate GFAP+ (red) and Acet-Tub+ projections (blue) in in the midgut of (AC) 7 dpf larvae, scale bar: 20 microns, and (DF) 18 dpf larvae, scale bar: 40 microns. Nuclei revealed by DAPI (cyan). White-dashed box corresponds to region of magnification (A′–C′) scale bar: 5 microns, and (D′–F′) scale bar: 5 microns.

Axon and glial cell patterning within the myenteric plexus of the larval zebrafish hindgut. Maximum intensity confocal projections of transverse cryosections indicate GFAP+ (red) and Acet-Tub+ projections (blue) in the hindgut of (AC) 7 dpf larvae, scale bar: 20 microns, and (DF) 18 dpf larvae with axon projecting close to IE (arrow), scale bar: 40 microns. Nuclei revealed by DAPI (cyan). White-dashed box corresponds to region of magnification (A′–C′) scale bar: 5 microns, and (D′–F′) scale bar: 5 microns.

Transmission electron microscopy (TEM) characterizes glial cells and axon ultrastructure within the larval zebrafish foregut. TEM reveals ultrastructure of myenteric plexus neuropil of the foregut in (A,B′) 7 dpf and (CE′) 18 dpf larvae. Magenta-dashed box corresponds to region of magnification (A′–E′). Intestinal epithelium (IE), nucleus (N), nuclear body (NB), muscularis (M), axon (Ax), type 1 glia (T1G) and type 2 glia (T2G). Scale bars denote the following: (A) 500 nm, (A′) 250 nm, (B) 500 nm, (B′) 250 nm, (C) 500 nm, (D) 200 nm, (E) 1 micron and (E′) 500 nm. Yellow arrows in (A) point to large granular vesicles, black arrowheads in (B′) and white arrowheads in (D,E′) point to caveolae.

TEM characterizes glial cells and axon ultrastructure within the larval zebrafish midgut. TEM reveals ultrastructure of myenteric plexus neuropil of the midgut in (A,B′) 7 dpf and (C,D′) 18 dpf larvae. Magenta-dashed box corresponds to region of magnification (A′–D′). Intestinal epithelium (IE), nucleus (N), muscularis (M), endothelial cell (EC), type 1 glial (T1G) and type 2 glia (T2G). Scale bars denote the following: (A) 500 nm, (A′) 250 nm, (B) 500 nm, (B′) 250 nm, (C) 500 nm, (C′) 250 nm, (D) 500 nm, (D′) 250 nm. Yellow arrows in (A′,B′) and white arrows in (C′) point to electron dense junctions between T1G and T2G.

TEM characterizes glial cells and ultrastructure within the larval zebrafish hindgut. TEM reveals ultrastructure of myenteric plexus neuropil of the hindgut in (A,B′) 7 dpf and (CE) 18 dpf larvae. Magenta-dashed box corresponds to region of magnification (A′–D′). Intestinal epithelium (IE), nucleus (N), muscularis (M), axon (Ax), endothelial cell (EC), type 1 glial (T1G) and type 2 glia (T2G). Scale bars denote the following: (A) 500 nm, (A′) 250 nm, (B) 500 nm, (B′) 250 nm, (C) 500 nm, (D) 500 nm, (D′) 200 nm and (E) 200 nm. Black arrowhead in (A′) points to caveolae and to axon bundles in (D′).

Acknowledgments
This image is the copyrighted work of the attributed author or publisher, and ZFIN has permission only to display this image to its users. Additional permissions should be obtained from the applicable author or publisher of the image. Full text @ Sci. Rep.