- Title
-
Germline Stem Cells Drive Ovary Regeneration in Zebrafish
- Authors
- Cao, Z., Mao, X., Luo, L.
- Source
- Full text @ Cell Rep.
|
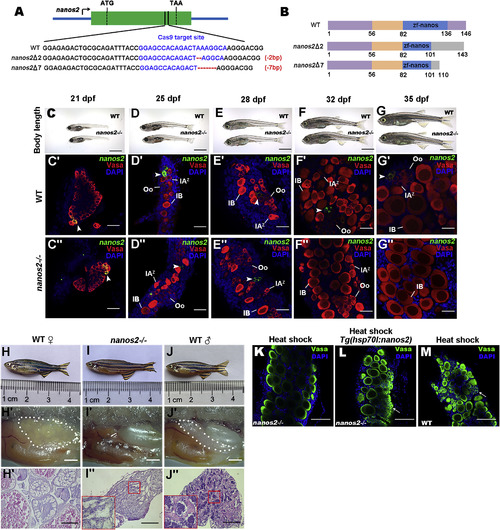
nanos2 Is Required for Maintaining GSCs (A) Schematic diagram of nanos2 genomic structure and mutation genotypes. (B) Schematic representation of the protein functional domains of nanos2 from wild-type (WT) and two kinds of mutants (Zf-nanos, Zinc finger-nanos). (C–G) Body length of wild-type (WT) and nanos2homozygous at 21 (C), 25 (D), 28 (E), 32 (F), and 35 (G) dpf. (C′–G″) Triple fluorescent labeling with FISH-nanos2, anti-Vasa antibodies, and 4′,6-diamidino-2-phenylindole (DAPI) staining in the ovaries of wild-type and nanos2 homozygous at 21, 25, 28, 32, and 35 dpf. Note loss of GSCs (arrowheads) in the mutant starting at 32 dpf. (H–J) Adult wild-type female (H), the nanos2 mutant (I), and wild-type males (J). (H′–J′) Lateral views of gonads. (H″–J″) H&E staining of gonad sections shows that all of the nanos2 mutants develop into the sterile males. (K–M) At 40 dpf after heat-shock, double staining by anti-Vasa antibodies, and DAPI in the nanos2 mutants with (L) or without (K) Tg(hsp701:nanos2) transgenic background, and in the wild-type (M) shows that overexpression of nanos2 could rescue the phenotypes of nanos2 mutant. Arrows indicate early germ cells. Oo, oogonia; IAz, zygotene-stage-IA; IB, stage IB oocyte. Scale bars: 500 μm (C–G), 50 μm (C′–G′′), 1 mm (H′–J′), 200 μm (H′′–J′′), 50 μm (K–M). See also Figure S1.
EXPRESSION / LABELING:
PHENOTYPE:
|
|
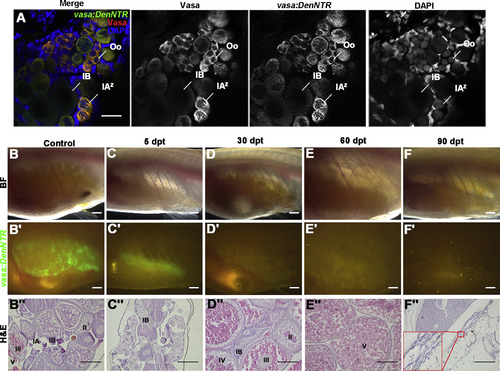
Ovary Regeneration Is Defective after Genetic Ablation of GSCs and Sex Reversal Finally Occurs (A) Comparison of Vasa protein and vasa:DenNTRexpression in ovary shows the Dendra2 fully overlaps with Vasa, suggesting that vasa:DenNTR is able to label all of the germ cells. (B–B″) The Tg(vasa:DenNTR)cq41 females of about 3 months old have big ovaries in bright field (BF) (B), strong green fluorescent (B′), and different stage germ cells (B″). (C–C″) At 5 dpt, the ovarian size largely decreases (C and C′) and except stage I and II oocytes, the germ cells are ablated by Mtz (C″). (D–D″) The ovaries become large and have mature oocytes at 30 dpt (D) but little green fluorescent is observed (D′), and the early stage germ cells were not detected (D″). (E–E″) By 60 dpt, the fish ovaries only have stage V cells. (F–F″) Testis (arrowheads) that lack germ cells appears at 90 dpt, showing that the females treated with Mtz reverted to sterile males. Oo, oogonia; IAz, zygotene-stage-IA; IA, stage IA oocytes; IB, stage IB oocyte; II, stage II oocyte; III, stage III oocyte; IV, stage IV oocyte; V, stage V oocyte. Scale bars: 50 μm (A), 1 mm (B–F′), 200 μm (B″–F″). See also Figure S2. PHENOTYPE:
|
|
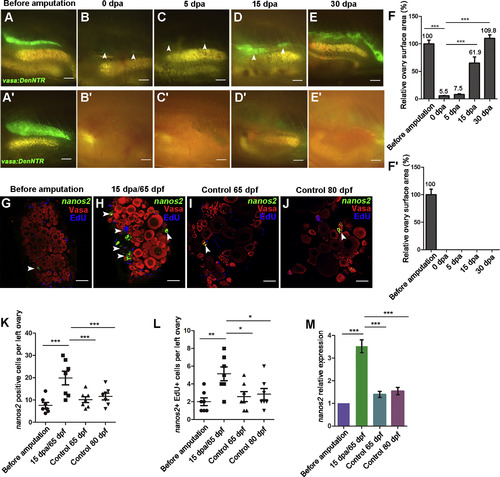
Residual GSCs Are Highly Proliferative during Ovary Regeneration (A–E) Most of the left ovary was removed and could be completely recovered in a month. Zebrafish ovary at 50 dpf/before amputation (A), 0 (B), 5 (C), 15 (D), and 30 (E) dpa. Arrowheads indicate the remaining or regenerating ovarian tissues (n = 5). (A′–E′) Complete amputation of the left ovary causes failure of regeneration (n = 5). (F and F′) Quantification of ovary surface area at 0, 5, 15, and 30 dpa. Values represent the size of the largest left ovary surface area (n = 5, mean ± SEM, ∗∗∗p < 0.001, two-tailed t test, error bars indicate SEM). (G–J) Triple fluorescent labeling of ovaries with FISH-nanos2, anti-Vasa antibodies, and EdU at different stages including 50 (G), 65 (I), and 80 (J) dpf without amputation, as well as 15 dpf/65 dpf after amputation (H). Note the increased number and proliferation of nanos2-positive cells (arrowheads) at 15 dpa. (K) Quantification of nanos2-positive cells per left ovary before amputation and at 15 dpa, 65 dpf, and 80 dpf (n = 7, mean ± SEM, ∗∗∗p < 0.001, two-tailed t test, error bars indicate SEM). (L) Quantification of nanos2+ EdU+ double-positive cells per left ovary before amputation and at 15 dpa, 65 dpf, and 80 dpf. (n = 7, mean ± SEM, ∗∗p < 0.01, ∗p < 0.05, two-tailed t test, error bars indicate SEM). (M) nanos2 expression level measured by qRT-PCR (n = 7, mean ± SEM, ∗∗∗p < 0.001, two-tailed t test, error bars indicate SEM). Scale bars: 1 mm (A–E′), 50 μm (G–J). See also Figure S3. (F–F″) Testis (arrowheads) that lack germ cells appears at 90 dpt, showing that the females treated with Mtz reverted to sterile males. Oo, oogonia; IAz, zygotene-stage-IA; IA, stage IA oocytes; IB, stage IB oocyte; II, stage II oocyte; III, stage III oocyte; IV, stage IV oocyte; V, stage V oocyte. Scale bars: 50 μm (A), 1 mm (B–F′), 200 μm (B″–F″). See also Figure S2. PHENOTYPE:
|
|
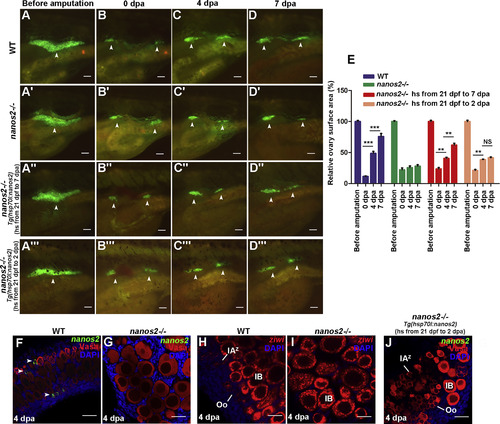
The Ovary of nanos2 Mutant Fails to Regenerate (A–D′) The ovaries of the wild-type juvenile under the Tg(vasa:DenNTR)cq41 transgenic background were imaged at before amputation/32 dpf (A), 0 (B), 4 (C), and 7 (D) dpa. The ovaries of nanos2 mutant were imaged at the same stages (A′–D′), showing little regeneration in contrast to the wild-type (A–D). (A′–D′) The nanos2 mutants juvenile with Tg(vasa:DenNTRcq41; hsp70l:nanos2cq42) genetic background were heated shock from 21 dpf on and the ovaries were amputated at 32 dpf. (A″–D″) Heat-shock (hs) is from 21 dpf to 7 dpa/39 dpf. (A″′–D″′) Heat-shock is from 21 dpf to 2 dpa/34 dpf. (E) Quantification of ovary surface area of wild-type and nanos2 mutant at 0, 4, and 7 dpa. (n = 5, mean ± SEM, ∗∗∗p < 0.001, ∗∗p < 0.01, NS represents no significance, two-tailed t test, error bars indicate SEM). (F and G) Triple fluorescent labeling with FISH-nanos2, anti-Vasa antibodies, and DAPI staining in the ovaries of wild-type (F) and the nanos2 mutant (G) 4 dpa. (H and I) Double labeling of FISH-ziwi and DAPI staining in the ovaries of wild-type (H) and nanos2mutant (I) at 4 dpa. (J) Triple fluorescent labeling with nanos2 RNA probe, Vasa antibodies, and DAPI staining in the nanos2homozygous ovaries at 4 dpa, which were heat-shocked from 21 dpf to 2 dpa. Scale bars: 500 μm (A–D″′), 50 μm (F–J). (F–F″) Testis (arrowheads) that lack germ cells appears at 90 dpt, showing that the females treated with Mtz reverted to sterile males. Oo, oogonia; IAz, zygotene-stage-IA; IA, stage IA oocytes; IB, stage IB oocyte; II, stage II oocyte; III, stage III oocyte; IV, stage IV oocyte; V, stage V oocyte. Scale bars: 50 μm (A), 1 mm (B–F′), 200 μm (B″–F″). See also Figure S2. EXPRESSION / LABELING:
PHENOTYPE:
|
|
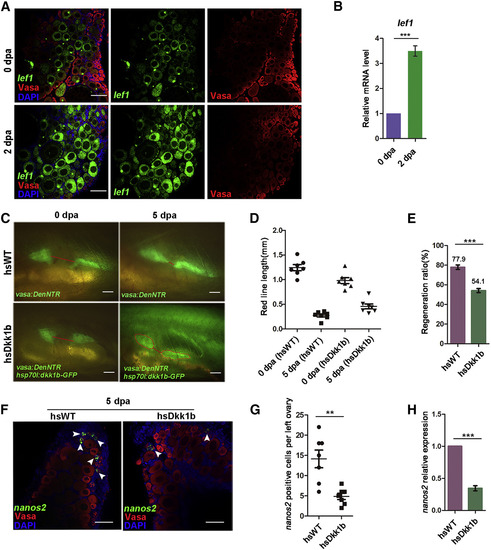
Wnt Signaling Is Activated and Regulates Ovary Regeneration (A) RNA fluorescent in situ hybridization of lef1 shows upregulation of lef1 expression at 2 dpa compared to 0 dpa. (B) lef1 expression level measured by qRT-PCR (∗∗∗p < 0.001, two-tailed t test, error bars indicate SEM). (C) The ovary regeneration in dkk1b-overexpressing fish is blocked at 5 dpa compared to heat-shocked wild-type (hsWT). The red lines represented the distance between two remaining ovarian tissues after amputation. (D) Quantification of the red line lengths of hsWT and hsDkk1b at 0 dpa and 5 dpa for 7 samples in the same group (n = 7). (E) Quantification of regenerative ratio of hsWT and hsDkk1b at 5 dpa (n = 7, mean ± SEM, ∗∗∗p < 0.001, two-tailed t test, error bars indicate SEM). (F) Triple fluorescent labeling with nanos2 RNA probe, Vasa antibodies, and DAPI staining both in the hsWT and hsDkk1b fishes at 5 dpa. Arrowheads point to GSCs. (G) Quantification of the number of GSCs in the ovarian remnant per left ovary at 5 dpa (n = 7, mean ± SEM, ∗∗p < 0.01, two-tailed t test, error bars indicate SEM). (H) nanos2 expression level measured by qRT-PCR (n = 7, mean ± SEM, ∗∗∗p < 0.001, two-tailed t test, error bars indicate SEM). Scale bars: 100 μm (A), 1 mm (C), 50 μm (F). See also Figures S4 and S5. (F–F″) Testis (arrowheads) that lack germ cells appears at 90 dpt, showing that the females treated with Mtz reverted to sterile males. Oo, oogonia; IAz, zygotene-stage-IA; IA, stage IA oocytes; IB, stage IB oocyte; II, stage II oocyte; III, stage III oocyte; IV, stage IV oocyte; V, stage V oocyte. Scale bars: 50 μm (A), 1 mm (B–F′), 200 μm (B″–F″). See also Figure S2. EXPRESSION / LABELING:
PHENOTYPE:
|

ZFIN is incorporating published figure images and captions as part of an ongoing project. Figures from some publications have not yet been curated, or are not available for display because of copyright restrictions. PHENOTYPE:
|

