- Title
-
Vitamin D Stimulates Cardiomyocyte Proliferation and Controls Organ Size and Regeneration in Zebrafish
- Authors
- Han, Y., Chen, A., Umansky, K.B., Oonk, K.A., Choi, W.Y., Dickson, A.L., Ou, J., Cigliola, V., Yifa, O., Cao, J., Tornini, V.A., Cox, B.D., Tzahor, E., Poss, K.D.
- Source
- Full text @ Dev. Cell
|
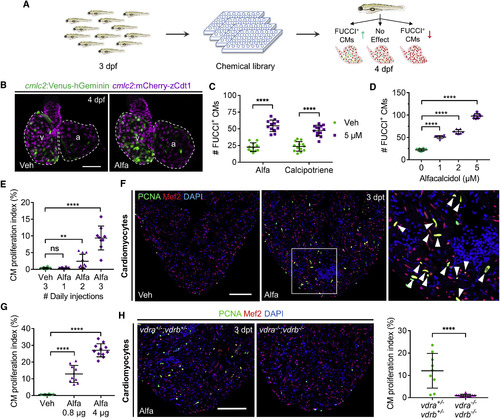
Vitamin D Analogs Promote Cardiomyocyte Proliferation in Zebrafish (A) Cartoon schematic of in vivo chemical screen for regulators of CM proliferation using cmlc2:FUCCI zebrafish embryos. dpf, days post-fertilization. (B) Maximum intensity projection (MIP) images of dissected cmlc2:FUCCI hearts. Veh, vehicle; v, ventricle; a, atrium. Scale bar, 50 μm. (C) Quantification of FUCCI+ CMs after 24-h treatment. Mean ± SD, Mann-Whitney test and Student’s t test. ∗∗∗∗p < 0.0001. n = 11–13. (D) Quantification of FUCCI+ CMs after 24-h treatment. Mean ± SD, Mann-Whitney test and Student’s t test. n = 7–10. (E) Quantification of adult ventricular CM proliferation indices. Mean ± SD, Mann-Whitney test and Student’s t test. ns, not significant; ∗∗p < 0.01. n = 9–10. (F) Representative images of PCNA/Mef2 staining quantified in (E). Boxed area is enlarged on the right. Arrowheads indicate PCNA+CMs. dpt, days post-treatment. Scale bar, 100 μm. (G) Ventricular CM proliferation indices of vehicle- or Alfa-injected adult zebrafish. Mean ± SD, Mann-Whitney test and Student’s t test. n = 10–12. (H) Representative images and quantification of ventricular PCNA/Mef2 staining. Mean ± SD, Mann-Whitney test. n = 9–10. Scale bar, 100 μm. |
|
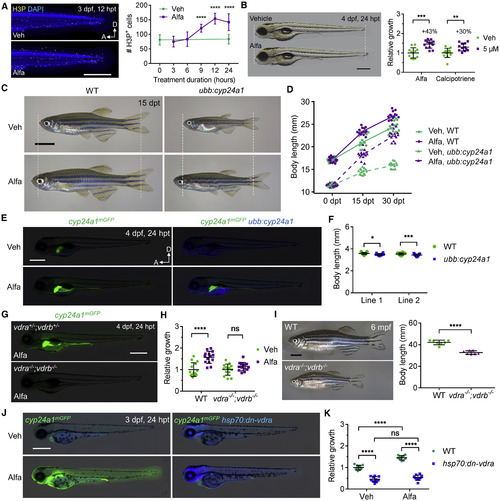
Vitamin D Signaling Enhances Organismal Size (A) MIP images and quantification of H3P staining of 3 dpf embryos. hpt, hours post-treatment; H3P, phospho-Histone H3. Mean ± SD, Mann-Whitney test and Student's t test. ∗∗∗∗p < 0.0001. n = 11–13. Scale bar, 500 μm. (B) Example and quantification of 4 dpf zebrafish growth. Mean ± SD, Mann-Whitney test and Student’s t test. ∗∗p < 0.01; ∗∗∗p < 0.001. n = 12-14. Scale bar, 500 μm. (C) Growth and rescue of 2 mpf juvenile wild-type (WT) and ubb:cyp24a1 zebrafish. Scale bar, 4 mm. (D) Quantification of zebrafish length before and after treatment. Mean ± SD. n = 14–15. (E) mGFP and TagBFP expression in 4 dpf embryos treated with vehicle or 10 nM Alfa. Scale bar, 500 μm. (F) Quantified body length of two independent ubb:cyp24a1 lines and WT siblings at 4 dpf. Mean ± SD, Mann-Whitney test. ∗p < 0.05. n = 14–23. (G) cyp24a1mGFP expression in 1 μM Alfa-treated embryos. (H) Quantification of relative growth of 4 dpf embryos treated with vehicle or Alfa for 24 h. Mean ± SD, Student’s t test. n = 13. (I) Representative images and body length quantification of 6 mpf zebrafish. mpf, months post-fertilization. Mean ± SD, Student's t test. n = 7. Scale bar, 5 mm. (J) mGFP and TagBFP expression of 3 dpf embryos after a single heat-shock and 24-h drug treatment. Scale bar, 500 μm. (K) Quantified relative growth of 4 dpf embryos after a heat shock and 24-h drug treatment. Mean ± SD, Student’s t test. n = 10. EXPRESSION / LABELING:
PHENOTYPE:
|
|
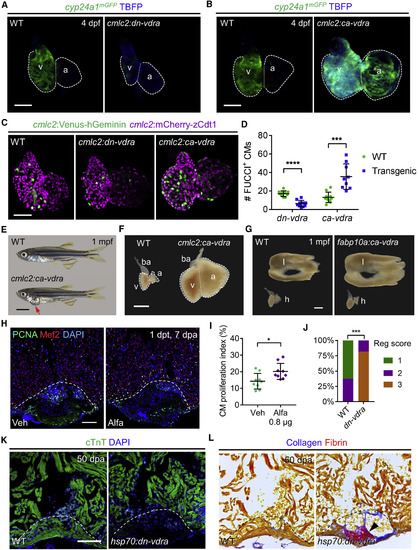
Tissue-Intrinsic Effects of Vitamin D Signaling and Impact on Heart Regeneration (A) MIP images of cyp24a1mGFP expression in dissected hearts. Scale bar, 50 μm. (B) MIP images of cyp24a1mGFP expression in dissected hearts. Scale bar, 50 μm. (C) MIP images of dissected cmlc2:FUCCI hearts in indicated transgenic backgrounds. Scale bar, 50 μm. (D) Quantification of FUCCI+ CMs in (C). Mean ± SD, Mann-Whitney test and Student's t test. ∗∗∗p 0.001; ∗∗∗∗p < 0.0001. n = 9–10. (E) Examples of 1 mpf cmlc2:ca-vdra and WT zebrafish. Red arrow indicates gross pericardial enlargement caused by cardiomegaly in cmlc2:ca-vdra zebrafish. Scale bar, 2 mm. (F) Darkfield images of dissected 1 mpf hearts. a, atrium; ba, bulbus arteriosus; v, ventricle. Scale bar, 500 μm. (G) Darkfield images of dissected livers (l) and hearts (h) from 1 mpf zebrafish. Scale bar, 500 μm. (H) Examples of Mef2/PCNA staining of 7 dpa hearts after a single injection. Dashed lines represent amputation planes. Scale bar, 100 μm. (I) Quantification of CM proliferation indices in (H). Mean ± SD, Mann-Whitney test. ∗p < 0.05. n = 9. (J) Quantified heart regeneration scores of WT or hsp70:dn-vdra(dn-vdra) zebrafish given daily heat shocks from 6 to 50 dpa. Regeneration scores (reg scores) indicate vigorous regeneration (1), partial regeneration (2), or blocked regeneration (3), as shown in Figure S3N. Two-tailed Fisher’s exact test. ∗∗∗p < 0.001. n = 8–11. (K) Representative images of cTnT staining at 50 dpa, after daily heat shock from 6 dpa. Scale bar, 100 μm. (L) Representative images of AFOG stains to indicate fibrin (red) and collagen (blue) within the same hearts in (K). Arrowheadindicates scar tissue. |
|
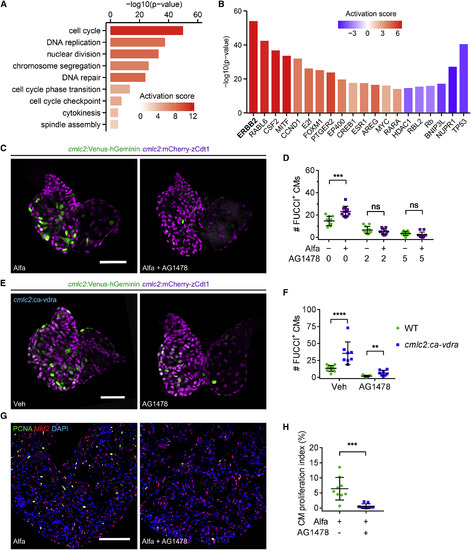
Figure 4. ErbB2 Blockade Inhibits Vitamin D-Induced Cardiomyocyte Proliferation (A) Selected functional cluster enrichment of differentially expressed genes. The activation score infers the activation score of the corresponding process. (B) Selected common upstream regulators of differentially expressed genes in adult hearts after three Alfa injections. The p value measures the statistical significance of the overlap between differentially expressed genes and the genes under predicted control of a regulator, and the activation score infers the activation state and score of a regulator, either activating (positive) or inhibiting (negative). (C) MIP images of dissected 4 dpf cmlc2:FUCCI hearts after 24-h treatment. Scale bar, 50 μm. (D) Quantification of FUCCI+ CMs of 4 dpf cmlc2:FUCCI embryos after 24-h treatment. Mean ± SD, Mann-Whitney test and Student’s t test. ns, not significant; ∗∗∗p < 0.001. n = 11. (E) MIP images of dissected 4 dpf hearts after 24-h treatment. Scale bar, 50 μm. (F) Quantification of FUCCI+ CMs of 4 dpf embryos after 24-h treatment. Mean ± SD, Mann-Whitney test and Student’s t test. ∗∗p < 0.01; ∗∗∗∗p < 0.0001. n = 8–11. (G) PCNA/Mef2 staining of ventricles from Alfa-injected zebrafishtreated with vehicle or AG1478 for 24 h, starting at 2 h after the last Alfa injection. Scale bar, 100 μm. (H) Quantification of CM proliferation indices of experiments in (H). Mean ± SD, Student’s t test. n = 9. |
|
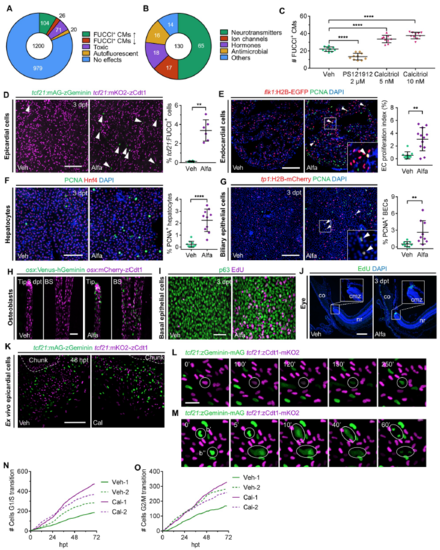
Chemical Screening Identifies Mitogenic Effects of Vitamin D in Zebrafish (Related to Figure 1) (A) Distribution of the effects of 1,200 compounds from primary screen on CM proliferation. (B) Functional grouping of 130 compounds with effects on CM proliferation. (C) Quantification of FUCCI+ CMs in larvae treated with vehicle, 2 μM PS121912 or 5, 10 nM calcitriol. n = 10, 10, 9, 10, respectively. (D) Whole-mount images and quantification of epicardial cell proliferation from the cardiac surfaces of adult tcf21:FUCCI fish injected with vehicle or Alfa. FUCCI+ epicardial cells are defined as mAG-zGeminin+; mKO2-zCdt1− cells (arrowheads). n = 6 for both groups. **p < 0.01. Scale bar, 100 μm. (E) Section images and quantification of PCNA+ endocardial cells (flk1:H2B-EGFP+) of adult zebrafish injected with vehicle or Alfa. Arrowheads indicate proliferating endocardial cells. n=10, 12 respectively. **p < 0.01. Scale bar, 100 μm. (F) Section images and quantification of PCNA+ hepatocytes (Hnf4+) of adult zebrafish injected with vehicle or 0.8 μg Alfa. n = 10 for both groups. ****p < 0.0001. Scale bar, 50 μm. (G) Section images and quantification of PCNA+ billary epithelial cells (BECs) (tp1:H2BmCherry+) of adult zebrafish injected with vehicle or Alfa. Arrowheads indicate proliferating BECs. n = 9 for both groups. **p < 0.01. Scale bar, 100 μm. (H) Maximum intensity projection images of caudal fin rays from osx:FUCCI fish injected with vehicle or 0.8 μg Alfa. Fin rays were imaged at distal tip regions (Tip) and the first bifurcation sites (BS). n = 10 for both groups. Scale bar, 50 μm. (I) Images of whole-mounted caudal fins stained for p63 (to mark basal skin epithelial cells; green) and incorporated EdU (magenta), from animals treated with vehicle or 0.8 μg Alfa. EdU was injected 6 hours before fin collection. n = 3 for both groups. Scale bar, 50 μm. (J) Section images of eye tissue from adult zebrafish injected with vehicle or 0.8 μg Alfa, stained for EdU incorporation. EdU was injected 24 hours before eye collection. Insets show higher magnification views of the boxed regions. co, cornea; cmz, ciliary marginal zone; nr, neural retina. n = 9, 11 respectively. Scale bar, 100 μm. (K) Representative images of ex vivo cultured epicardial explants treated with vehicle or 1 μM calcitriol for 48 hours. Dashed lines represent the outlines of adult tcf21:mAGzGeminin; tcf21:mKO2-zCdt1 chunk explants. Cal, calcitriol. Scale bar, 200 μm. (L) zCdt1-mKO2 was degraded followed by zGeminin-mAG accumulation in the circled cell at indicated times, reflecting G1-to-S transition. Scale bar, 20 μm. (M) In the circled cells, nuclear zGeminin-mAG proteins diffused throughout the cells and gradually relocalized to two presumed daughter nuclei, reflecting G2-to-M transitions and cell divisions. (N) Cumulative frequencies of cells undergoing G1/S transition of two vehicle (Veh) and calcitriol (Cal)-treated ex vivo explants respectively shown in (K) over a 69-hour period. (O) Cumulative frequencies of cells undergoing G2/M transition of two vehicle (Veh) and calcitriol (Cal)-treated ex vivo explants respectively shown in (K) over a 69-hour period. |
|
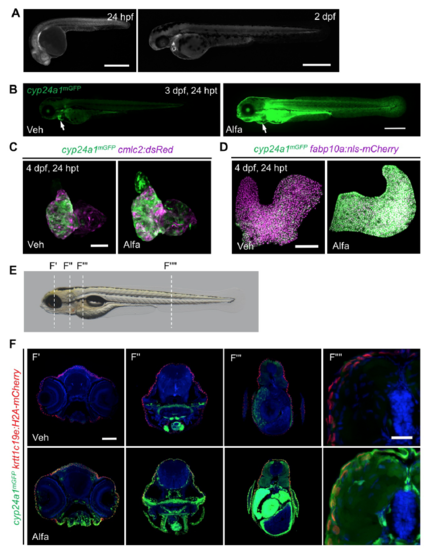
cyp24a1mGFP Reporter Fish Indicate Vitamin D Activity (Related to Figure 2) (A) mGFP fluorescence in 24 hpf and 48 hpf cyp24a1mGFP embryos. Scale bar, 500 μm. (B) Lateral view of a cyp24a1mGFP reporter knock-in at 3 dpf following treatment with vehicle or Alfa for 24 hours. Arrowheads indicate cardiac mGFP fluorescence. Scale bar, 500 μm. (C) Maximum intensity projection images of dissected 4 dpf cmlc2:dsRed;cyp24a1mGFP hearts after vehicle or Alfa treatment for 24 hours. Scale bar, 50 μm. (D) Maximum intensity projection images of dissected 4 dpf fabp10a:nls-mCherry; cyp24a1mGFP livers (to mark hepatocytes) after vehicle or Alfa treatment for 24 hours. Scale bar, 100 μm. (E) Representative 4 dpf wild-type embryo from Figure 2B indicating section plane of Figures F’ to F’’’’ with dashed lines. (F) Maximum projections of 10 μm confocal sections at indicated planes of 4 dpf krtt1c19e:H2A-mCherry; cyp24a1mGFP (to mark basal epithelial cells) embryos treated with vehicle or Alfa. Scale bars, 100 μm for F’-F’’’ and 20 μm for F’’’’. |
|
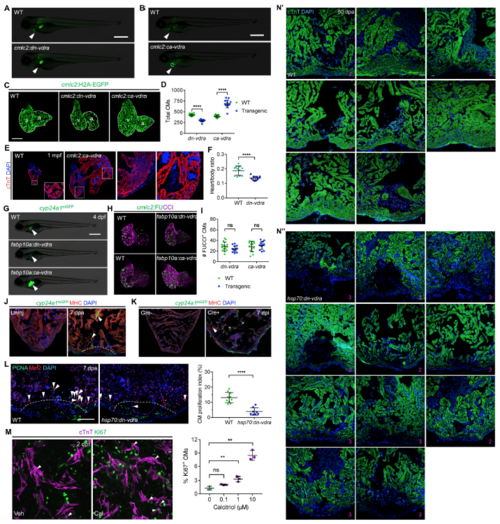
Regulation of Cardiomyocyte Proliferation and Heart Regeneration by Vitamin D (Related to Figure 3) (A) Lateral view of cyp24a1mGFP expression in 4 dpf wild-type (WT) and cmlc2:dn-vdra sibling embryos. The image acquisition exposure was increased for both genotypes to better visualize cardiac expression (arrowheads). Scale bar, 500 μm. (B) Lateral view of cyp24a1mGFP expression in 4 dpf WT and cmlc2:ca-vdra sibling embryos. Images were merged with dim brightfield images to indicate whole embryos. Arrowheads indicate hearts. Scale bar, 500 μm. (C) Representative maximum projection images of dissected hearts from 4 dpf cmlc2:H2A-EGFP larvae in WT, cmlc2:dn-vdra and cmlc2:ca-vdra backgrounds. Scale bar, 50 μm. (D) Quantification of CM numbers from hearts of WT, cmlc2:dn-vdra and cmlc2:ca-vdra embryos. ****p < 0.0001. n = 15 for all groups. (E) Maximum intensity projection images of cTnT expression in 1 mpf WT and cmlc2:cavdra hearts. Boxed regions were enlarged in inset or on the right side. Note the massive growth of both ventricular and atrial cardiomyoctes in cmlc2:ca-vdra hearts. (F) Quantification of 2 mpf WT and cmlc2:dn-vdra heart-to-body ratio. The ratio was calculated as area of ventricle (mm2) divides body length (mm). ****p < 0.0001. n = 11, 12 respectively. (G) Lateral view of cyp24a1mGFP expression in 4 dpf WT, fabp10a:dn-vdra, and fabp10a:ca-vdra embryos. Note the images were merged with brightfield images to indicate whole embryos. Arrowheads indicate livers. Scale bar, 500 μm. (H) Maximum intensity projection images of dissected 4 dpf cmlc2:FUCCI hearts from fabp10a:dn-vdra or fabp10a:ca-vdra and their wild-type siblings. Scale bar, 50 μm. (I) Quantification of FUCCI+ CMs for experiments in b. n=15, 14, 14, 12, respectively. ns, not significant. (J) Maximum intensity projection images of uninjured and 7 dpa hearts of cyp24a1mGFP reporter. Arrowheads indicate expression in cardiomyocytes. (K) Maximum intensity projection images of MHC staining for cyp24a1mGFP reporter crossed with Z-CAT fish at 7 days post tamoxifen treatment (dpi). Arrowhead indicates expression in cardiomyocytes and asterisks indicate expression in endocardial cells. (L) Representative images and quantification of Mef2+PCNA+ nuclei versus total Mef2+ nuclei from wild-type or hsp70:dn-vdra zebrafish at 7 dpa after heat-shock induction protocols, indicating reduced CM proliferation during heart regeneration. Dashed lines represent amputation planes. n = 10, 8, respectively. ****p < 0.0001. Scale bar, 100 μm. (M) Representative images and quantification of proliferation of early postnatal (P7) mouse CMs cultured and treated with vehicle or calcitriol for 72 hours. cTnT is a marker of CMs and Ki67 is a nuclear marker of cell proliferation. Arrowheads indicate Ki67+ CM nuclei. Three biological replicate experiments were performed with three technical repeats for each concentration. ns, not significant; **p < 0.01. (N) Confocal images of injured ventricles stained for cTnT (CM) expression from wildtype (N’) or hsp70:dn-vdra (N’’) zebrafish at 50 dpa following daily heat-shocks beginning at 6 dpa. n = 8, 11, respectively. Magenta numbers at the bottom right corners are regeneration scores for Figure 3J. |
|
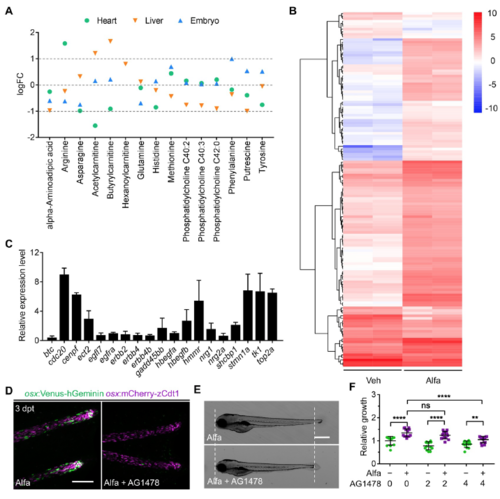
Vitamin D-Regulated Proliferation and Growth Require ErbB2 Signaling (Related to Figure 4) (A) Metabolomic analysis indicating metabolites in heart, liver, or whole-embryo that were significantly changed by alfacalcidol treatment. Only the metabolites showing statistically different levels in at least one tissue type are shown. (B) Heat map of the relative expression levels of the differentially expressed genes that are predicted to be regulated by ErbB2 signaling pathway using IPA software. (C) Quantitative RT-PCR of selected ErbB2/ErbB4 ligands (tan), receptors (light blue) and target genes (gray) in Alfa-injected hearts over control hearts. Data are shown as relative expression from two biological repeats. eef1a1l1 was used as internal control. (D) Representative maximum projection images of osx:Venus-hGeminin; osx:mCherryzCdt1 (FUCCI) caudal fin rays from Alfa-injected zebrafish treated with vehicle or AG1478 for 24 hours starting at 2 hours after the last Alfa injection. Scale bar, 100 μm. (E) Lateral view of 4 dpf embryos treated with Alfa or Alfa + AG1478 for 24 hours. Scale bar, 500 μm. (F) Quantification of lengths of 4 dpf embryos treated with vehicle, Alfa, AG1478 or Alfa + AG1478 at the indicated concentrations (μM) for 24 hours. n = 13 for all groups. ns, |
Reprinted from Developmental Cell, 48(6), Han, Y., Chen, A., Umansky, K.B., Oonk, K.A., Choi, W.Y., Dickson, A.L., Ou, J., Cigliola, V., Yifa, O., Cao, J., Tornini, V.A., Cox, B.D., Tzahor, E., Poss, K.D., Vitamin D Stimulates Cardiomyocyte Proliferation and Controls Organ Size and Regeneration in Zebrafish, 853-863.e5, Copyright (2019) with permission from Elsevier. Full text @ Dev. Cell

