- Title
-
Homozygous splicing mutation in NUP133 causes Galloway-Mowat syndrome
- Authors
- Fujita, A., Tsukaguchi, H., Koshimizu, E., Nakazato, H., Itoh, K., Kuraoka, S., Komohara, Y., Shiina, M., Nakamura, S., Kitajima, M., Tsurusaki, Y., Miyatake, S., Ogata, K., Iijima, K., Matsumoto, N., Miyake, N.
- Source
- Full text @ Ann. Neurol.
|
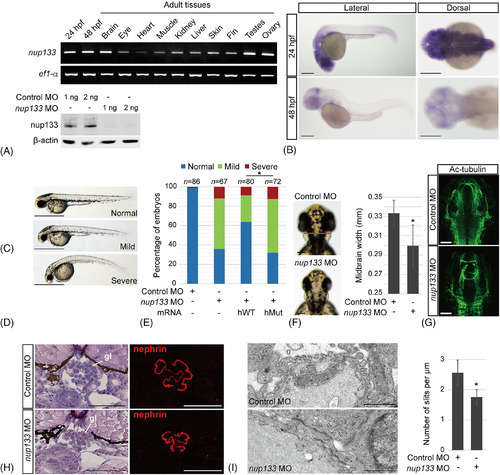
nup133‐knockdown zebrafish model showing abnormal neuronal and renal tissue development. (A) Reverse transcriptase–polymerase chain reaction analysis of nup133 in the zebrafish at 24 and 48 hours postfertilization (hpf; 5 embryos were mixed and used in each experiment). In adult tissues, strong bands were observed for nup133 in the brain, testes, ovary, skin, and kidney with faint bands detected for the eye, fin, heart, and muscle. Zebrafish ef1‐α was used as the loading control. (B) Whole‐mount in situ hybridization demonstrated the expression patterns of nup133 during early development (24 and 48 hpf). Whole‐mount in situ hybridization with the sense nup133 (negative control) probe showed no signal (data not shown). Scale bars = 250 μm. (C) Administration of antisense nup133 morpholinos (MOs) efficiently inhibited nup133 expression based on Western blot analysis. β‐Actin was used as the loading control. (D) Gross morphology of the control MO‐injected and nup133 MO‐injected embryos. Lateral views of the MO‐injected embryos (2ng) at 48 hpf are shown. Scale bars = 1mm. (E) MO‐injected embryo phenotypes were categorized as either normal (indistinguishable from wild‐type embryos), mild, or severe at 48 hpf. hMut = human mutant; hWT = human wild‐type; *p < 0.05 using the χ2 test. Rescue experiments were independently triplicated. (F) Head size of the control MO‐injected and nup133 MO‐injected embryos at 48 hpf. Dorsal views of the midbrain width were measured (red lines). Scale bars = 100 μm. The data are shown in the right‐hand graph and are represented as the mean ± standard deviation (SD), n = 20 in both groups; *p < 0.05 using Student t test. (G) Representative dorsal views of immunolabeling with anti‐HuC/D and anti–acetylated tubulin (Ac‐tubulin) at 48 hpf. The nup133 MO‐injected embryos exhibited disorganized central nervous systems compared with the control MO‐injected embryos. Scale bars = 100 μm. (H) Hematoxylin–eosin staining of transverse sections of a glomerulus (gl) in control MO‐injected and nup133 MO‐injected larvae at 5 days postfertilization (dpf). The right‐hand panels show nephrin immunostaining. Scale bars = 50 μm. (I) Electron microscopy of MO‐injected larvae at 5 dpf. Scale bars = 1 μm. Measurement of the slit numbers is shown in the podocyte membrane in the control MO‐injected and nup133 MO‐injected larvae. The data are summarized in the right‐hand graph. Values represent the mean ± SD; control MO, n = 8 sections; nup133 MO, n = 10 sections; *p < 0.05 using Student t test. |

