- Title
-
Tanshinol stimulates bone formation and attenuates dexamethasone-induced inhibition of osteogenesis in larval zebrafish
- Authors
- Luo, S., Yang, Y., Chen, J., Zhong, Z., Huang, H., Zhang, J., Cui, L.
- Source
- Full text @ J Orthop Translat
|
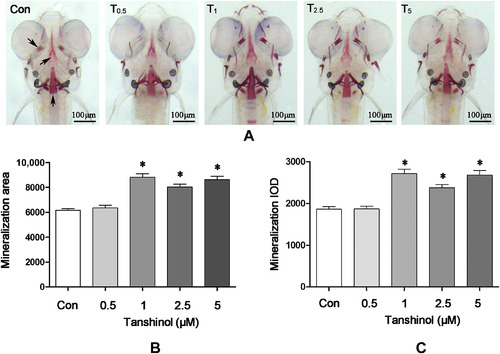
Effects of tanshinol on bone mineralisation of wild-type AB strains zebrafish larval skull. Images of (A) the dorsal aspect head bone stained with alizarin red in wild-type AB strains zebrafish larvae at 9 days' postfertilisation (dpf) with or without exposure to tanshinol (0.5μM, 1μM, 2.5μM, 5μM); (B) the effect of tanshinol on bone mineralisation area in 9-dpf zebrafish; and (C) the effect of tanshinol on bone mineralisation integral optical density in 9-dpf zebrafish. Con = control, egg water; IOD = integral optical density; T0.5 = tanshinol 0.5μM; T1 = tanshinol 1μM; T2.5 = tanshinol 2.5μM; T5 = tanshinol 5μM. Data are given as mean ± standard deviation (n ≥ 9). *p < 0.05 versus control. PHENOTYPE:
|
|
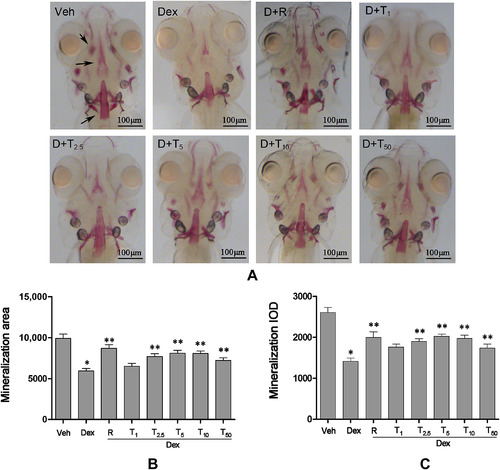
Protective effects of tanshinol on head bone mineralisation of wild-type AB strains zebrafish larval exposed to dexamethasone (Dex). Images of (A) the dorsal aspect head bone stained with alizarin red in wild-type AB strains zebrafish larvae at 9 days' postfertilisation (dpf) exposed to Dex (10μM) in the presence or absence of tanshinol; (B) the effect of tanshinol on bone mineralisation area in 9-dpf zebrafish exposed to Dex; and (C) the effect of tanshinol on bone mineralisation integral optical density in 9-dpf zebrafish exposed to Dex. Dex = Dex 10μM; D+R = Dex + rocalirol 6 × 10⁻⁶ μg/mL); D+T1 = Dex + tanshinol 1μM; D+T2.5 = Dex + tanshinol 2.5μM; D+T5 = Dex + tanshinol 5μM; D+T10 = Dex + tanshinol 10μM; D+T50 = Dex + tanshinol 50μM; IOD = integral optical density; Veh = vehicle control, 0.1% dimethyl sulphoxide. Data are given as mean ± standard deviation (n ≥ 9). *p < 0.05 versus vehicle control. **p < 0.05 versus Dex treatment. PHENOTYPE:
|
|
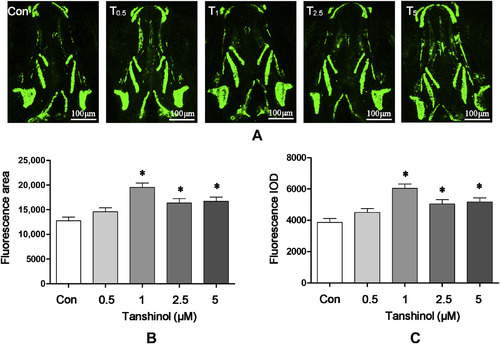
Effects of tanshinol on osteoblasts differentiation in tg(sp7:egfp) zebrafish larvae. Fluorescence images of (A) the dorsal aspect measured using laser scanning confocal microscopy in tg(sp7:egfp) zebrafish larvae at 9 days' postfertilisation (dpf) with or without tanshinol (0.5μM, 1μM, 2.5μM, 5μM). (B) Effect of tanshinol on green fluorescence area of 9-dpf tg (sp7:egfp) zebrafish. (C) Effect of tanshinol on green fluorescence integral optical density of 9-dpf tg (sp7:egfp) zebrafish. Con = control, egg water; IOD = integral optical density; T0.5 = tanshinol 0.5μM; T1 = tanshinol 1μM; T2.5 = tanshinol 2.5μM; T5 = tanshinol 5μM. Data are given as mean ± standard deviation (n ≥ 9). ∗p < 0.05 versus vehicle control. PHENOTYPE:
|
|
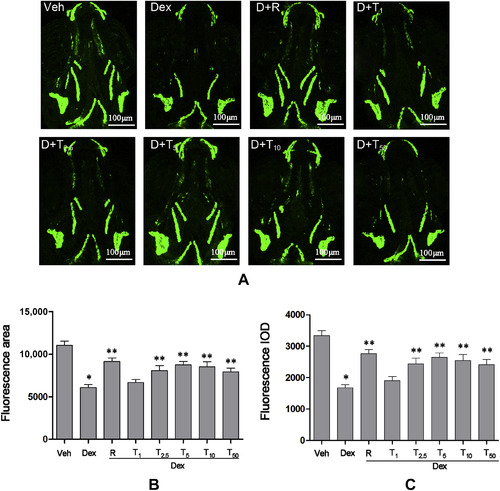
Protective effects of tanshinol counteracting dexamethasone (Dex)-induced inhibition of osteoblasts differentiation in tg(sp7:egfp) zebrafish larvae. (A) Fluorescence images of the dorsal aspect measured with laser scanning confocal microscopy in tg(sp7:egfp) zebrafish larvae at 9 days' post fertilisation (dpf) exposure to Dex (10μM) in the presence or absence of tanshinol. (B) Effect of tanshinol on fluorescence area in 9-dpf tg (sp7:egfp) zebrafish exposed to Dex. (C) Effect of tanshinol on fluorescence integral optical density in 9-dpf tg (sp7:egfp) zebrafish exposed to Dex. Dex = Dexamethasone 10μM; D+R = Dex + rocalirol 6 × 10⁻⁶ μg/mL; D+T1 = Dex + tanshinol 1μM; D+T2.5 = Dex + tanshinol 2.5μM; D+T5 = Dex + tanshinol 5μM; D+T10 = Dex + tanshinol 10μM; D+T50 = Dex + tanshinol 50μM; IOD = integral optical density; Veh = vehicle control, 0.1% dimethyl sulphoxide. Data are given as mean ± standard deviation (n ≥ 9). *p < 0.05 versus vehicle control. **p < 0.05 versus Dex treatment. PHENOTYPE:
|

ZFIN is incorporating published figure images and captions as part of an ongoing project. Figures from some publications have not yet been curated, or are not available for display because of copyright restrictions. |

ZFIN is incorporating published figure images and captions as part of an ongoing project. Figures from some publications have not yet been curated, or are not available for display because of copyright restrictions. PHENOTYPE:
|


