
- Title
-
Impaired caudal fin-fold regeneration in zebrafish deficient for the tumor suppressor Pten
- Authors
- Hale, A.J., Kiai, A., Sikkens, J., den Hertog, J.
- Source
- Full text @ Regeneration (Oxf)

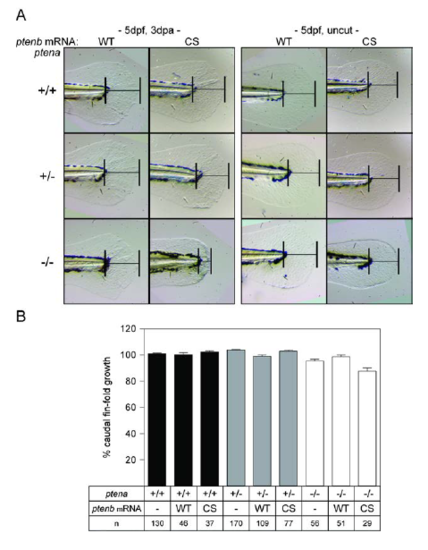
Impaired caudal fin‐fold regeneration in Pten deficient embryos. (A) Embryos from a ptena+/−ptenb−/− in‐cross were micro‐injected at the one‐cell stage with synthetic mRNA encoding WT Ptenb (WT), catalytically inactive Ptenb‐C124S (CS), or were not injected (−). At 2 dpf the caudal fin‐fold was amputated and regeneration was assessed at 3 dpa (i.e., 5 dpf, 3 dpa); equivalent uncut controls were included (i.e., 5 dpf, uncut). All embryos were genotyped. Representative images of non‐injected embryo caudal fin‐folds are shown, and of WT Ptenb or Ptenb‐C124S‐injected embryos in Fig. S1. (B) The means of caudal fin‐fold growth following amputation are depicted relative to caudal fin‐fold growth of uncut ptena+/+ptenb−/− controls. Means of micro‐injected amputated ptena−/−ptenb−/− embryos were compared to non‐injected amputated ptena−/−ptenb−/− embryos. Significance: ***p < 0.001; n.s., not significant; error bars indicate standard error of the mean. Data pooled from multiple experiments
|

Elevated p‐AKT in the caudal fin‐folds of Pten deficient embryos by 4 dpf. (A) Caudal fin‐folds of embryos from a ptena+/−ptenb−/− in‐cross were amputated and fixed at 2 dpa (i.e., 4 dpf, 2 dpa) and subjected to whole‐mount immunohistochemistry using a p‐AKT‐specific antibody (p‐S473) (yellow). The embryos were counterstained with DAPI (blue). Representative images of amputated embryo caudal fin‐folds are shown and in the left panels the edge of the fin‐fold is indicated with a dashed line. The number of embryos showing similar patterns/total number of embryos analyzed is indicated in the bottom right corner. The scale bar represents 100 μm. (B) p‐AKT was quantified by mean intensity of the region between the notochord and the edge of the caudal fin‐fold. Equivalent uncut controls were also quantified (representative pictures depicted in Fig. S3A). Means within amputated or uncut groups are compared to ptena+/+ptenb−/− embryos. Significance: **p < 0.01; error bars represent standard deviation
|
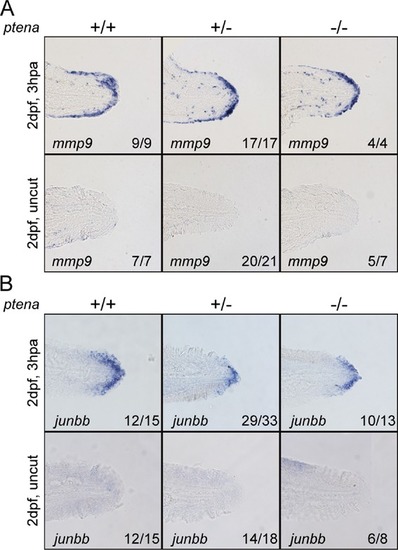
Blastema formation in Pten deficient embryos. At 2 dpf the caudal fin‐fold of embryos from a ptena+/−ptenb−/− in‐cross was amputated and allowed to regenerate. Embryos were fixed at 3 hpa, or equivalent for uncut controls, and subjected to in situ hybridization for mmp9 (A) or junbb (B). Representative images of embryo caudal fin‐folds are shown, and the number of embryos showing similar patterns/total number of embryos analyzed is indicated in the bottom right corner of each panel
|
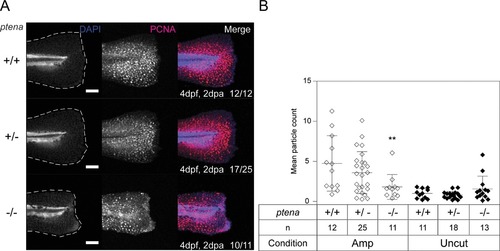
Arrested proliferation at the edge of the amputated caudal fin‐fold of Pten deficient embryos by 2 dpa. (A) Embryos from a ptena+/−ptenb−/− in‐cross were fixed at 2 dpa (i.e., 4 dpf, 2 dpa) and subjected to whole‐mount immunohistochemistry using an antibody specific for PCNA (red). The embryos were counterstained with DAPI (blue). Maximum intensity projection images were taken of the caudal fin‐folds and all embryos were genotyped. Representative images of amputated embryo caudal fin‐folds are shown and the number of embryos showing similar patterns/total number of embryos analyzed is indicated in the bottom right corner of the right panels. The scale bar represents 100 μm. (B) PCNA immunofluorescence between the tip of the notochord and edge of the caudal fin‐fold was quantified by mean particle count. Means within amputated or uncut groups were compared to ptena+/+ptenb−/− embryos. Significance: **p < 0.01; error bars represent standard deviation
|

Enhanced apoptosis in the caudal fin‐folds of Pten deficient embryos by 4 dpf. (A) Embryos from a ptena+/−ptenb−/− in‐cross were amputated at 2 dpf, fixed at 2 dpa and subjected to whole‐mount immunohistochemistry using an antibody specific for activated caspase‐3 (green). Embryos were counterstained with DAPI (blue). Representative images of amputated embryo caudal fin‐folds are shown, and the number of embryos showing similar patterns/total is indicated. Scale bar: 100 μm. Zoomed images of each caudal fin‐fold are shown. White arrowheads indicate cells; red arrowheads indicate background staining. (B) Caspase‐3 immunofluorescence was quantified by mean particle count of the caudal fin‐fold, following thresholding and size restriction to reduce background signal. Means within amputated or uncut groups were compared to ptena+/+ptenb−/− embryos. Significance: **p < 0.01; ***p < 0.001; error bars represent standard deviation. (C) Embryos from a ptena+/−ptenb−/− in‐cross were amputated and allowed to regenerate. Live embryos were stained with acridine orange (AO), for 30 min at 2 dpa (i.e., 4 dpf, 2 dpa). Representative images of embryo caudal fins are shown. AO staining at 3 dpf and of equivalent uncut controls at 4 dpf is shown in Fig. S7
|
Impaired caudal fin-fold regeneration in Pten deficient embryos. (A) Embryos from a ptena+/-tenb-/- in-cross were micro-injected at the one-cell stage with synthetic mRNA encoding WT Ptenb (WT), catalytically inactive Ptenb-C124S (CS), or were not injected (-). At 2dpf the caudal fin-fold was amputated and regeneration was assessed after 3 days (i.e. 5dpf, 3dpa), equivalent uncut controls were included (i.e. 5dpf, uncut). All embryos were genotyped. Representative images of micro-injected embryo caudal fin-folds are shown. (B) Uncut caudal fin-fold growth was quantified by measuring the distance from the tip of the notochord to the edge of the caudal fin-fold. The means of uncut caudal fin-fold growth are depicted relative to caudal fin-fold growth of uncut ptena+/+ptenb-/- controls. Means of micro-injected ptena-/-ptenb-/- embryos were compared to non-injected ptena-/-ptenb-/- embryos. Error bars indicate standard error of the mean. |
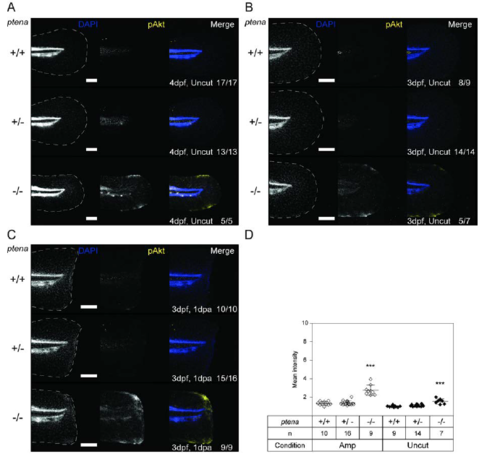
Elevated p-AKT in the caudal fin-folds of Pten deficient embryos. (A) Uncut embryos from a ptena+/-ptenb-/- in-cross were fixed at 4dpf (4dpf, uncut) in parallel to the embryos depicted in Fig. 2A. (B, C) Embryos from a ptena+/-ptenb-/- in-cross were amputated and fixed at 1dpa (i.e. 3dpf, 1dpa), equivalent uncut controls (3dpf, uncut) were included. Embryos were subjected to whole-mount immunohistochemistry using a p-AKT-specific antibody (p-S473) (yellow). The embryos were counterstained with DAPI (blue). Representative images of embryo caudal fin-folds are shown, and in the left panels the edge of the fin-fold is indicated with a dashed line. Number of embryos showing similar patterns/ total number of embryos analysed is indicated in the bottom right corner. The scale bar represents 100μm. (D) p-AKT immunofluorescence was quantified by mean intensity of the region between the notochord and the edge of the caudal fin-fold. Means within amputated or uncut groups are compared to ptena+/+ptenb-/- embryos. The number of embryos analysed is indicated (n). Significance: *** p<0.001; error bars represent standard deviation. Quantification of p-AKT immunofluorescence at 4dpf is depicted in Fig. 2B. |

In situ hybridization staining of and1 in Pten deficient embryos. At 2dpf the caudal fin-fold of embryos from a ptena+/-ptenb-/- in-cross was amputated and allowed to regenerate. Embryos were fixed at 3hpa, or equivalent for uncut controls, and subjected to in situ hybridization for and1. Representative images of embryo caudal fin-folds are shown with the number of embryos/ total number of embryos in the bottom right corner of each panel. |

Normal proliferation in the caudal fin-folds of Pten deficient embryos. (A) Uncut embryos from a ptena+/-ptenb-/- in-cross were fixed at 4dpf (4dpf, uncut) in parallel to the embryos depicted in Fig. 5. (B, C) Embryos from a ptena+/-ptenb-/- in-cross were amputated and fixed at 1dpa (i.e. 3dpf, 1dpa), equivalent uncut controls (3dpf, uncut) were included. Embryos were subjected to whole-mount immunohistochemistry using an antibody specific for the cell proliferation marker PCNA (red). The embryos were counterstained with DAPI (blue). Representative images of embryo caudal fin-folds are shown, and in the left panels the edge of the fin-fold is indicated with a dashed line. Number of embryos showing similar patterns/ total number of embryos analysed is indicated in the bottom right corner. The scale bar represents 100μm. (D) PCNA immunofluorescence between the tip of the notochord and edge of the caudal fin-fold at 3dpf was quantified by mean particle count, with thresholding and size restriction to remove background signal. Equivalent uncut controls were also quantified. Means within amputated or uncut groups were compared to ptena+/+ptenb-/- embryos. Significance: * p<0.05; error bars represent standard deviation. Quantification of PCNA immunofluorescence at 4dpf is depicted in Fig. 6B. |
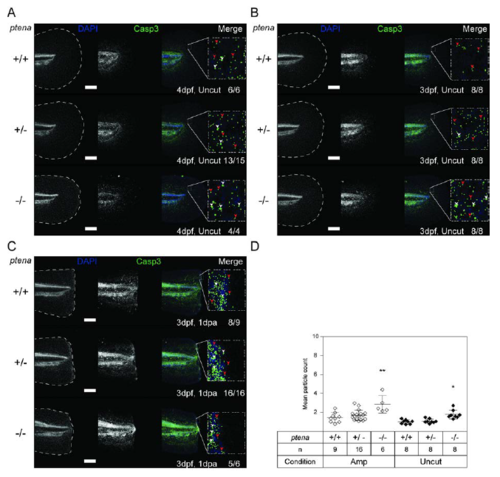
Enhanced apoptosis in the caudal fin-folds of Pten deficient embryos. (A) Uncut embryos from a ptena+/-ptenb-/- in-cross were fixed at 4dpf (4dpf, uncut) in parallel to the embryos depicted in Fig. 6A. (B, C) Embryos from a ptena+/-ptenb-/- in-cross were amputated and fixed at 1dpa (i.e. 3dpf, 1dpa) , equivalent uncut controls (3dpf, uncut) were included. Embryos were subjected to whole-mount immunohistochemistry using an antibody specific for the apoptosis marker activated Caspase-3 (green). The embryos were counterstained with DAPI (blue). Representative images of embryo caudal fin-folds are shown, and in the left panels the edge of the fin-fold is indicated with a dashed line. Number of embryos showing similar patterns/ total number of embryos analysed is indicated in the bottom right corner. The scale bar represents 100μm. Zoom-in images of each caudal fin-fold are shown. White arrowheads indicate cells; red arrowheads indicate background staining. (D) Caspase-3 immunofluorescence was quantified by mean particle count of the caudal fin-fold following thresholding and size restriction to reduce background signal. Means within amputated or uncut groups are compared to ptena+/+ptenb-/- embryos. The number of embryos analysed is indicated (n). Significance: * p<0.05; ** p<0.01; error bars represent standard deviation. Quantification of Caspase-3 immunofluorescence at 4dpf is depicted in Fig. 6B. |

Enhanced apoptosis in the caudal fin-folds of live Pten deficient embryos. Embryos from a ptena+/-ptenb-/- in-cross were amputated and allowed to regenerate. Embryos were stained at 2dpa (i.e. 4dpf, 2dpa) or 1dpa (i.e. 3dpf, 1dpa), or equivalent for uncut controls (i.e. 4dpf, uncut; or 3dpf, uncut), with a dye for cells undergoing apoptosis, acridine orange, for 30mins. Representative images of embryo caudal fin-folds at are shown, and the edge of the fin-fold is indicated with a dashed line. Number of embryos showing similar patterns/ total number of embryos analysed is indicated in the bottom right corner. Representative images for embryos stained at 4dpf, 2dpa are shown in Fig. 7C. |