
- Title
-
A Brain-Derived Neurotrophic Factor Mimetic Is Sufficient to Restore Cone Photoreceptor Visual Function in an Inherited Blindness Model
- Authors
- Daly, C., Shine, L., Heffernan, T., Deeti, S., Reynolds, A.L., O'Connor, J.J., Dillon, E.T., Duffy, D.J., Kolch, W., Cagney, G., Kennedy, B.N.
- Source
- Full text @ Sci. Rep.

dye mutants display aberrant retinal morphology. Representative lateral and dorsal views in brightfield of sibling larvae (a,a′) and dye mutants (b,b′), displaying pigmentation and gross morphological defects present in the dye mutant, including swim bladder deflation compared to sibling (*in a) and pericardial oedema (black arrow in b). Transverse sections of the retina and ciliary marginal zone of sibling larvae (c,e) and dye mutants (d,f), pyknotic nuclei (red arrows in d,f) present in the ciliary marginal zone indicated dying cells. Transmission electron micrographs of photoreceptors in sibling larvae (g) and dye mutants (h) displaying shortened photoreceptor OS and aberrant morphology despite preserved ultrastructure (i,j). RPE cells in dye mutants are hypopigmented and contain large inclusion bodies compared to sibling larvae (k,l), and the RPE fails to interdigitate with photoreceptors in dye compared to siblings (N = 1 for sibling, N = 3 for dye mutants). (m–o) The mutation in dye affects the zebrafish atp6v0e1 gene. (m) Schematic representation of the exon-intron structure of atp6v0e1, purple lines indicate the annealing position of genotyping primers used in panel n. (n) 1% agarose gel of PCR products from different regions of the atp6v0e1 gene, a 180 bp deletion (white box, n) is detected in the region containing the terminal end of coding exon 3, the full length agarose gel image is included in the supplementary information (Supplementary Fig. S3a). (o) Sequencing of gel extracted PCR products and pairwise sequence alignment to the reference genome sequence (assembly GRCz11) revealed that the deletion removes the stop codon in, and the 3′ UTR encoded in exon 3 and of the GT splice donor site encoded at the exon 3-intron 3 border. PHENOTYPE:
|

dye mutants exhibit reduced/absent visual behaviour. (a) dye mutants have a reduced/absent OKR compared to unaffected siblings, data represented using a box and whiskers plot, N = 15 (number of larvae per replicate), n = 3 (number of replicates). (b–d) Average overall VMR activity of dye mutants (blue trace) and siblings (green trace), through the 1 h 40 minute experiment (b), graph depicts average activities of 12 larvae in 3 separate replicates. Peak activity in response to a transition from light to dark (c), and dark to light (d). Graphs in c and d depict the average activity from 2 transitions in one experiment and the average across 3 separate replicates, yellow and black bars represent dark and light periods. N = 12, n = 3 for VMR assays. Electroretinograms (e,f) depict sibling and dye responses to 20 ms flashes (black bar) at increasing light intensities (−3.0, −2.0, −1.0 and 0 optical densities), with a maximum light intensity of 2.8 × 10³ µW/cm2. Statistical analysis was carried out using a student’s t-test with unequal variances, ***p < 0.001, **p < 0.01. PHENOTYPE:
|
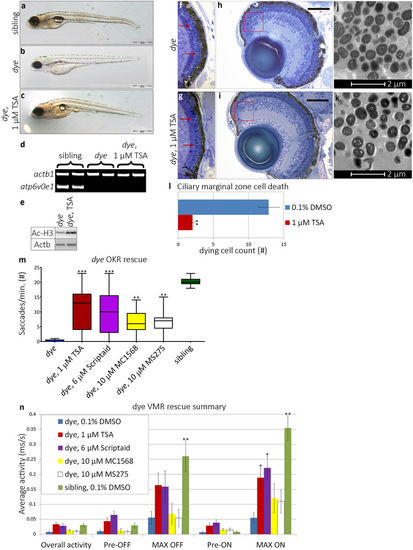
HDACi treatment rescues morphological and visual behaviour defects in dye mutants. (a–c) Lateral bright field images of sibling control (a), dye mutant control (b) and 1 µM TSA treated dye (c). TSA treatment partially rescued gross morphological defects, restoring pigmentation, eye size and swim bladder inflation. Scale bars represent 500 µm scale. (d) The dye genotype was confirmed by the absence of a PCR product from the atp6v0e1 gene, B-actin served as a positive control. (e) Increased histone H3 acetylation was observed by western blot in TSA treated dye larvae compared to control. (f,g) Light micrographs of dye retinal sections. Photoreceptor outer segments are less visible in control treated dye (f) compared to 1 µM TSA treated larvae (g) (red arrows, f,h). (h,i) Cell death in the ciliary marginal zone is reduced in 1 µM TSA treated dye mutants (i), indicated by a reduction in the number of pyknotic nuclei present (red boxes) compared to dye mutant control (h), scale bars represent 100 μm scale. (j,k) Electron micrographs of ultra-thin (500 nm) dye retinal sections, 1 µM TSA treatment (k) does not significantly rescue RPE hypopigmentation or reduce the number of RPE cells that contain inclusion bodies in comparison to dye mutant controls (j). (l) The number of pyknotic nuclei through multiple sections from the central retina and individual larvae is significantly reduced, N = 5, n = 3. (j) HDACi treated dye mutants have significantly improved OKR following treatment, N = 12 (number of larvae per replicate), n = 3 (number of replicates). (k) Summary of VMR activities, 1 µM TSA and 6 µM Scriptaid significantly improve the MAX ON activity, N = 12, n = 3. Statistical analyses were performed using a Kruskal-Wallis one-way analysis of variance and post-hoc Dunn’s multiple comparison test, comparing each group to 0.1% DMSO treated dye mutants, error bars represent average SEM, ***p < 0.001, **p < 0.01, *p < 0.05. Full length agarose gels and western blots are included in the supplementary information (Supplementary Fig. S3b–d). |
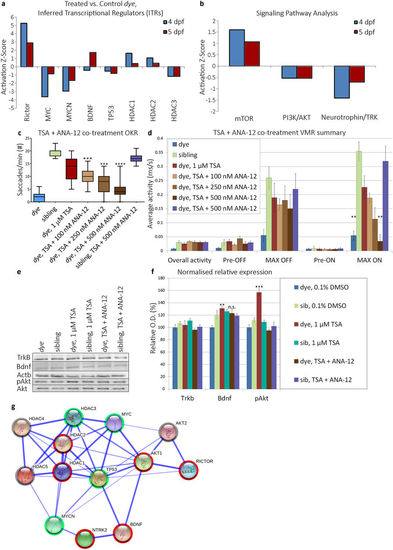
Identification and validation of HDACi mediated rescue pathway. (a) Activation/inhibition z-score plot of inferred transcriptional regulators (ITRs) in response to TSA treatment, at 4 and 5 dpf treatment end points in the dye mutant. ITRs were inferred by IPA from the HDAC inhibitor LC/MS:MS data. (b) Activation/inhibition z-score plot of identified HDACi modulated pathways, activation status is determined by abundance of downstream effector proteins present in the LC/MS:MS dataset. (c,d) Visual behaviour assay responses following co-treatment of TSA and ANA-12, an antagonist of the TrkB receptor, ANA-12 co-treatment results in a dose-dependent reduction in OKR (c). (d) Summary of VMR activity, ANA-12 co-treatment results in a dose-dependent reduction in the MAX ON response, changes in visual behaviour are compared to TSA only treated dye larvae, statistical analysis was performed using a Kruskal-Wallis one-way analysis of variance and post-hoc Dunn’s multiple comparison test, comparing each group to TSA only treated dye mutants. (e,f) Validation of differential expression of Bdnf, TrkB and effectors in the signaling pathway in 25 pooled eyes by western blot. TSA treatment increased expression of Bdnf, but not Trkb and this expression pattern was not affected by ANA-12 co-treatment. Akt (Thr308) phosphorylation was increased in TSA treated dye, while levels remained unchanged in ANA-12 co-treated larvae, N = 25 (number of eyes per replicate), n = 3 (number of replicates). Images represent a typical blot, bar chart represents signal intensity measured by densitometry, Trkb and Bdnf signals normalised to Actb expression and pAKT (Thr308) signal normalised to total Akt. Statistical analysis was performed using a two-tailed unpaired t-test in comparison to dye control. Error bars indicate S.E.M, ****p < 0.0001 ***p < 0.001, **p < 0.01. Full length western blots are included in supplementary information (Supplementary Fig. S3e–i). (g) Protein interaction map (generated by STRING-DB) of ITRs differentially expressed upon TSA treatment. Akt1, Akt2 and TrkB proteins were added to the network based on ITR pathway analysis and western blot data. Activated nodes are highlighted with red, downregulated nodes with green, grey highlighted nodes are predicted regulators but in which the direction is unknown. |

A BDNF mimetic treatment rescues visual function in dye mutants. (a,b) Gross morphology of control and 7,8-dihydroxyflavone hydrate (7,8-DHF) treated dye larvae, treatment does not rescue gross morphological defects. (c–h) Light micrographs of control, 7,8-DHF treated and 7,8-DHF + ANA-12 co-treated dye retinal sections. The number of pyknotic nuclei present in the ciliary marginal zone is significantly reduced following treatment with 7,8-DHF (rectangles f,g). This reduction in pyknotic nuclei is partially reversed by 7,8-DHF + ANA-12 co-treatment (h). (i,j) bar plots quantifying the average number of pyknotic nuclei present in multiple sections and replicate larvae following treatment (i) (N = 5, n = 3) and changes in area of the ciliary marginal zone in the central retina (n = 3) (j). (k) 7,8-DHF treated dye mutants have a significantly improved OKR, the degree of rescue is dose-dependent. (i) Likewise, treatment with 7,8-DHF rescues the VMR MAX ON and MAX OFF responses, statistically significant rescue was observed at 7.5 and 10 µM 7,8-DHF concentrations, N = 12 (number of larvae per replicate), n = 3 (number of replicates) for all groups. Visual function rescue was abrogated by ANA-12 co-treatment. Visual behaviour data was analysed by a Kruskal-Wallis one-way analysis of variance and post-hoc Dunn’s multiple comparison test, comparing each group to 7,8-DHF treated dye mutants, error bars represent average SEM. Comparison of pyknotic nuclei counts and comparison of CMZ area was performed using an ordinary one-way ANOVA, ***p < 0.001, **p < 0.01, *p < 0.05. PHENOTYPE:
|

Expression pattern of atp6v0e1 in wholemount and retinal sections of wildtype zebrafish larvae. (a-h) In situ hybridisation was carried out on 3 and 5 dpf wildtype larvae using antisense RNA probes to atp6v0e1 (n=3 for sense and antisense at each timepoint). In wholemount larvae (a-d), expression was detected in the brain and on the skin. At 3 and 5 dpf, expression is detected in the pectoral fins. The strongest expression levels were in the branchial arches at all timepoints (a,c). (e-h) 12 µm sections cut through the eyes of stained larvae revealed that expression was restricted to the dorsal RPE at 3 and 5 dpf (e,g), with higher expression levels at 3 dpf. (i) Agarose gel image for RT-PCR of atp6v0e1 and tcerg1, another candidate gene at the dye genetic locus. Expression of atp6v0e1 mRNA is absent in dye, N=50 (number of larvae per replicate), n=3 (number of replicates). |