
- Title
-
Studying Autophagy in Zebrafish
- Authors
- Mathai, B.J., Meijer, A.H., Simonsen, A.
- Source
- Full text @ Cells

( |
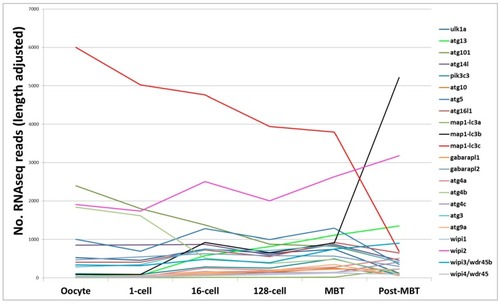
Messenger RNA sequence (mRNA-seq) analysis. Line plot of core autophagy gene transcripts analyzed by mRNA-seq in zebrafish embryos from the oocyte stage to post-mid blastula stage transition. |

Confocal imaging of Tg(CMV:GFP-Lc3). Representative confocal images of GFP-Lc3 puncta (autophagosomes) in the trunk area of GFP-Lc3 transgenic zebrafish embryos injected with control morpholino or Hslbp3 translational-blocking morpholino and imaged at 2 days post fertilization (dpf) with or without pre-treatment with chloroquine (10 mM) for 6 h. Scale bars, 10 µM for the confocal images. Panel A, B shows the whole zebrafish larvae at 2 days post fertilization highlighting the trunk area chosen for confocal imaging; Panel A’, A’’, B’, B’’ shows respective confocal images. |

Schematic overview of the autophagic pathway and a partial list of reagents (reagents used beyond 2014, |

Confocal imaging of Tg(CMV:EGFP-Mapllc3b) on infection. GFP-Lc3 signal around clusters of |