- Title
-
Mutations in TRAF3IP1/IFT54 reveal a new role for IFT proteins in microtubule stabilization
- Authors
- Bizet, A.A., Becker-Heck, A., Ryan, R., Weber, K., Filhol, E., Krug, P., Halbritter, J., Delous, M., Lasbennes, M.C., Linghu, B., Oakeley, E.J., Zarhrate, M., Nitschké, P., Garfa-Traore, M., Serluca, F., Yang, F., Bouwmeester, T., Pinson, L., Cassuto, E., Dubot, P., Elshakhs, N.A., Sahel, J.A., Salomon, R., Drummond, I.A., Gubler, M.C., Antignac, C., Chibout, S., Szustakowski, J.D., Hildebrandt, F., Lorentzen, E., Sailer, A.W., Benmerah, A., Saint-Mezard, P., Saunier, S.
- Source
- Full text @ Nat. Commun.
|
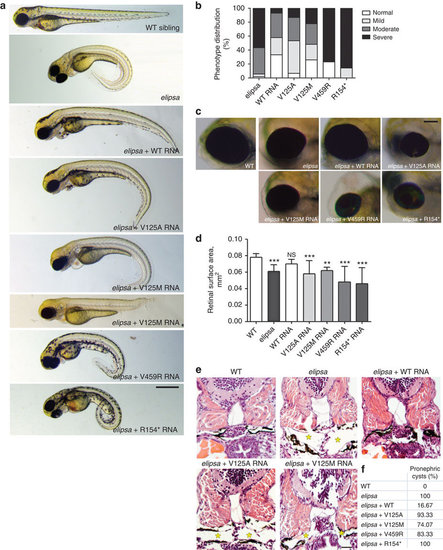
Patients mutations do not rescue the ciliopathy-associated phenotypes characteristic of elipsa mutants. (a) Lateral views of zebrafish larvae at 72 hpf of WT control, elipsa uninjected larvae and elipsa larvae injected with WT or mutant RNA constructs (p.R154* and p.V459R correspond to the human p.R155* and p.M520R mutations, respectively). Approximately 20% of V125M-injected elipsa larvae displayed an alternative stunted phenotype with pronephric cysts and eye defects, but lacking the characteristic body axis curvature. Scale bar, 0.5 mm. (b) Phenotype distribution as determined by quantification of angle of body axis curvature (n≥30, 4 independent experiments). (c) Eye phenotypes (5 dpf) of WT control, elipsa uninjected larvae and elipsa larvae injected with WT/mutant RNA constructs, lateral views, anterior to the left. Scale bar, 0.1 mm. (d) Surface area of the retina (mean ± s.d. of n=10, 2 independent experiments, *P=0.05, **P<0.01, and ***P<0.001, Dunnett’s multiple-comparison test). (e) H&E staining of histological cross sections of elipsa mutant larvae injected with WT or mutant RNA constructs at 72 hpf. Gross cystic dilations of the glomerular region extending to the pronephric tubule are indicated by asterisks. Scale bar, 20 μm. (f) Percentage of pronephric cysts in elipsa mutant larvae as well as rescued larvae (n≥30, 4 independent experiments). PHENOTYPE:
|

ZFIN is incorporating published figure images and captions as part of an ongoing project. Figures from some publications have not yet been curated, or are not available for display because of copyright restrictions. PHENOTYPE:
|
|
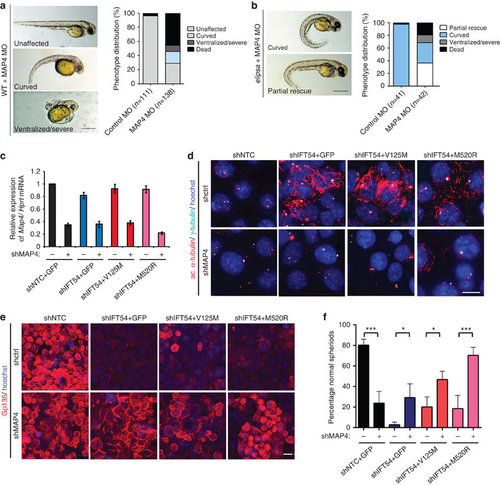
Defects in TRAF3IP1 mutants are mediated by MAP4. (a) Lateral views of WT zebrafish embryos injected with map4 morpholino at 48 hpf and phenotype distribution in WT embryos injected with control or map4 morpholino. (b) Lateral views of elipsa zebrafish embryos injected with map4 morpholino at 48 hpf and phenotype distribution in elipsa mutant embryos injected with control or map4 morpholino (data shown as combined result of n=3 independent experiments). Scale bars, 1 mm. (c) Relative expression of Map4 normalized to that of Hprt was analysed by qPCR in control and Traf3ip1-KD mIMCD3 cells stably expressing GFP or GFP-IFT54 mutants and Map4 shRNA. (d) Control and Traf3ip1-KD/ Map4-KD mIMCD3 cells expressing either GFP or IFT54-GFP fusions were fixed in MeOH and stained for acetylated α-tubulin (red) and γ-tubulin (light blue). Scale bar, 10 μm. (e) Six hours after Ca2+ switch, mIMCD3 cells grown until confluence on filters were fixed with 4% PFA and stained for the apical marker Gp135 (red). Scale bar, 10 μm. (f) Percentage of normal spheroids of control and Traf3ip1-KD/ Map4-KD mIMCD3 cells expressing either GFP or IFT54-GFP fusions grown on Matrigel for 5 days (mean ± s.d., n≥100 spheroids from 3 independent experiments, ***P≤0,0001, *P<0.012, Bonferonni's multiple-comparison test). PHENOTYPE:
|
|
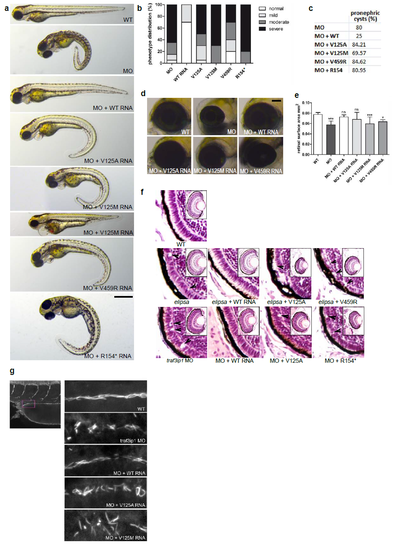
Patient mutations do not rescue the kidney and retinal phenotypes characteristic of traf3ip1 morphant larvae. (a) Body axis curvature phenotype of traf3ip1 morphant larvae (72 hpf) and morphant larvae co-injected with WT and mutant traf3ip1 RNA. Scale bar, 0.5 mm. (b) Phenotype distribution as determined by quantification of angle of body axis curvature (n=20, 3 independent experiments). (c) Percentage of pronephric cysts in morphant and rescued embryos (n≥20, 3 independent experiments). (d) Eye phenotypes (5 dpf) of WT, traf3ip1 morphant larvae, and larvae co-injected with traf3ip1 morpholino and WT/mutant RNA constructs. Scale bar, 0.1 mm. (e) Surface area of the retina (mean +/- SD of n=10 from 2 independent experiments, *P<0.05, **P< 0.01 and ***P< 0.001, Dunnett's multiplecomparison test) (f) H&E staining of histological cross sections through the eyes of elipsa mutant larvae and traf3ip1 morphant larvae injected with WT or mutant RNAs. Loss of photoreceptor cells is indicated by arrowheads. (g) Cilia in the pronephric duct (48 hpf) of indicated morphants were stained for acetylated-α-tubulin (n=9, 3 independent experiments). PHENOTYPE:
|


