- Title
-
Nephron proximal tubule patterning and corpuscles of Stannius formation are regulated by the sim1a transcription factor and retinoic acid in zebrafish
- Authors
- Cheng, C.N., Wingert, R.A.
- Source
- Full text @ Dev. Biol.
|
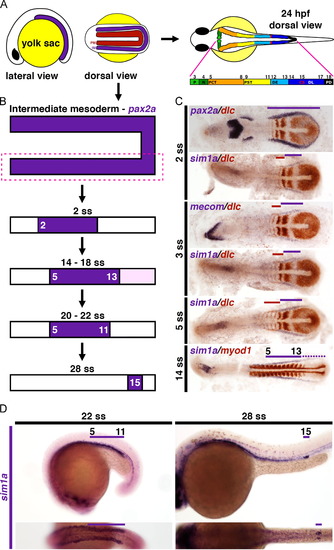
sim1a expression is dynamic during nephrogenesis. (A) Schematics depict the IM and PM domains in a young zebrafish embryo. At 24 hpf, the zebrafish pronephros consists of two segmented nephrons as indicated by the colored regions. Corresponding numbers indicate the boundaries of each segment respective to the somites. (B) Illustrations denote the developmental time course of sim1a expression, which first appears within the IM (pax2a+ domain) at the 2 ss. Dark purple indicates strong expression, while light purple signifies weak expression. (C) Flat mounted embryos staged at young developmental time points were assayed by WISH for the kidney markers pax2a, sim1a, or mecom (purple). The somites and proximal renal progenitors were labeled by dlc or myod1 (red). Solid lines (purple and red) demarcate renal progenitors regions where high transcript expression was observed. The dotted line (purple) indicates a weak expression domain, with line color corresponding to the gene identity indicated in figure. (D) Embryos at older stages were analyzed by WISH for sim1a expression (purple). Embryo anterior is located to the left in all panels. Abbreviations: CS – corpuscles of Stannius; DE – distal early; DL – distal late; hpf – hours post fertilization; IM – intermediate mesoderm; N – neck; P – podocytes; PCT – proximal convoluted tubule; PD – pronephric duct; PM – paraxial mesoderm; PST – proximal straight tubule; ss – somite stage; WISH – whole mount in situ hybridization. EXPRESSION / LABELING:
|
|
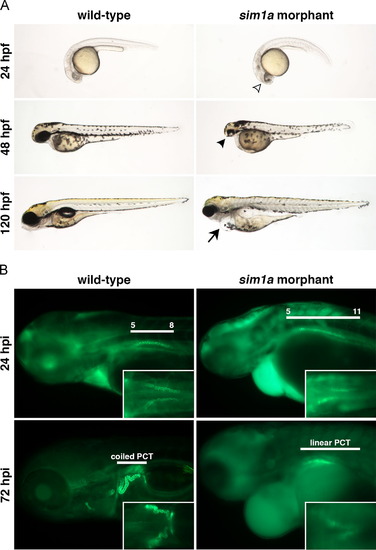
sim1a morphants display drastic developmental defects and abnormal kidney function. (A) A live time course shows the typical morphological phenotypes exhibited by sim1a morphants at different time points – open arrowhead demarcates darkened regions within the head; solid arrowhead indicates small head and eye phenotypes; solid arrow marks the presence of edema. (B) Kidney function in sim1a morphants was analyzed by a 40 kDa dextran-FITC uptake assay where injections were performed at approximately 38 hpf. sim1a morphants displayed partial PCT reabsorption (dorsal inset view) and reduced renal clearance of dextran-FITC over time, with persistent fluorescence throughout the head, trunk and pericardium when compared to wild-types. White lines indicate either the PCT domain in relation to the somites or the PCT morphology at given time points. Embryo anterior is to the left. Abbreviations: hpf – hours post fertilization; hpi – hours post injection; PCT – proximal convoluted tubule. |
|
The loss of sim1a results in the abrogation of the PST segment and the CS. (A) Segmentation patterning changes within the pronephros following sim1a knockdown were independently assessed by the utilization of MOs targeting the sim1a ATG and splice sites. Control 5 bp ATG mmMO injections were performed to further confirm the specificity of the sim1a translation-targeting MO. WISH of embryos at 24 hpf indicates the expression of specific kidney segment markers (purple) in relation to the somites, which were labeled with smyhc1 (red). Segment domains are further demarcated by black lines with corresponding somite numbers as indicated. Embryo anterior is to the left. (B) Diagram indicates the dominant segmentation phenotypes displayed by sim1a morphants in comparison to the wild-type controls at 24 hpf. Colored bars indicate the respective domains of each nephron segment in relation to the somite numbers located above. The striped regions within the colored bars signify areas with lower transcript expression. Abbreviations: CS – corpuscles of Stannius; DE – distal early; DL – distal late; hpf – hours post fertilization; mmMO – mismatch morpholino; MO – morpholino; PCT – proximal convoluted tubule; PST – proximal straight tubule; WISH – whole mount in situ hybridization. |
|
sim1a overexpression is partially sufficient to promote the PST and CS while inhibiting PCT fate. (A) Wild-type embryos injected with 200 pg of sim1a cRNA were assayed by WISH at 24 hpf with specific kidney segment markers, (purple), and with smyhc1 to demarcate the somites (red). Black lines indicate segment domains relative to somite numbers. Embryo anterior is to the left. Quantitative analyses utilizing the two-tailed Studentós t-test were performed to assess changes in the expression domains of (B) slc20a1a, (C) trpm7, (D) the size of individual stc1+ CS cells and (E) the size of the stc1+ area. (F) Summary of the sim1a overexpression phenotype. Colored bars indicate segment domains in relation to the corresponding somite numbers indicated above. Abbreviations: cRNA – capped RNA; CS – corpuscles of Stannius; DE – distal early; DL – distal late; hpf – hours post fertilization; OE – overexpression; PCT – proximal convoluted tubule; PST – proximal straight tubule; WISH – whole mount in situ hybridization. |
|
RA mediates the sim1a domain within the pronephric renal progenitor field. (A) Wild-type embryos were treated with either a DMSO control at 75% epi, exogenous RA (1×10⁸ M, denoted as+RA) at 50–60% epi, or 1.67×10⁵ M DEAB at 75% epi. Groups were treated with their respective chemical until the 5–7 ss and then analyzed for sim1a expression (purple) by WISH at the 18 and 28 ss. Transcripts encoding smyhc1 (red) mark the somites. Black lines with corresponding numbers indicate segment domains and somites, respectively. Embryo anterior is located to the left. Abbreviations: DEAB – 4-diethylaminobenzaldehyde; epi – epiboly; RA – retinoic acid; ss – somite stage; WISH – whole mount in situ hybridization. EXPRESSION / LABELING:
PHENOTYPE:
|
|
Increased RA levels promote the proximalization of the nephron but are not sufficient to rescue PST formation in sim1a morphants. (A) Wild-type embryos or (B) sim1a morphants were treated with either a 1×10⁷ M DMSO control, a low dose of RA (1×10⁸ M; denoted as+RA), or with a higher RA concentration of 1×10⁷ M (denoted as ++ RA). Both the DMSO control and ++ RA dose were given from the 90% epi to 5–7 ss while the+RA dose was applied from 90% epi to the 15 ss. Changes to nephron segmentation after the addition of RA was visualized by WISH in embryos at 24 hpf. The expression patterns of segment specific transcripts (purple) and smyhc1 transcripts, which marks the somites (red), are shown. Black lines with corresponding somite numbers were used to further illustrate segment domains. Embryo anterior is located to the left. (C) Schematic delineating the effects of low (+) and high (++) RA concentrations on nephron segmentation in wild-type embryos and sim1a morphants at 24 hpf. Nephron segments are represented by colored bars in relation to their corresponding somite numbers. Regions with lower transcript expression are indicated by stripes. Abbreviations: CS – corpuscles of Stannius; DE – distal early; DL – distal late; epi – epiboly; hpf – hours post fertilization; PCT – proximal convoluted tubule; PST – proximal straight tubule; RA – retinoic acid (+ RA – low; ++ RA – high dose); ss – somite stage; WISH – whole mount in situ hybridization. |
|
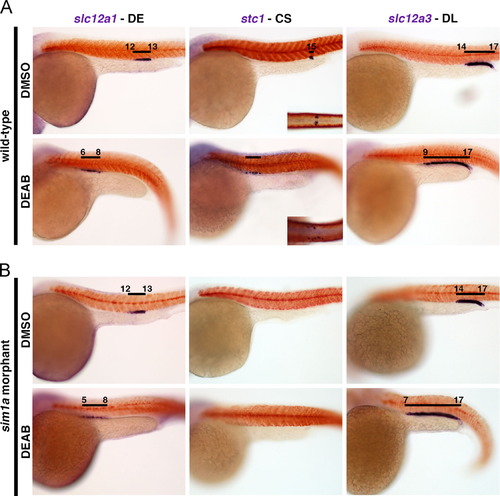
The inhibition of RA biosynthesis by DEAB induces distal fates but fails to rescue CS formation in sim1a morphants. DMSO control or 1.67×10⁵ M DEAB treatments of (A) wild-types or (B) sim1a morphant embryos from 75% epi to the 5–7 ss were performed. WISH analysis in embryos at 24 hpf for distal segment markers (slc12a1, stc1, and slc12a3) (purple) and the somites (smyhc1) (red). Black bars represent segment domains in correlation to somite numbers. Embryo anterior is located to the left. Insets show dorsal view of the CS. Abbreviations: CS – corpuscles of Stannius; DE – distal early; DEAB – 4-diethylaminobenzaldehyde; DL – distal late; epi – epiboly; hpf – hours post fertilization; ss – somite stage; WISH – whole mount in situ hybridization. |
|
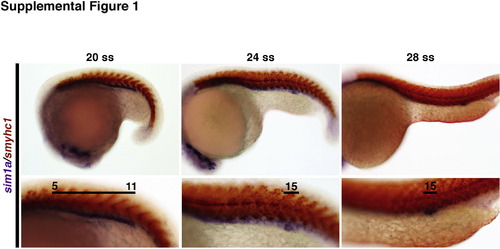
The sim1a domain undergoes dynamic changes during pronephros development. WISH analysis indicates the expression of sim1a transcripts (purple) at different developmental stages. Somites are marked by smyhc1 expression (red). Black lines demarcate renal progenitors regions where high transcript expression was observed, and numbers indicate the identity of the adjacent somite(s). Embryo anterior is located to the left. Magnifications of the top and bottom panels are 10× and 20× respectively. Abbreviations: ss – somite stage; WISH – whole mount in situ hybridization. |
|
sim1a morphants show increased cell death and reduced heart rate. (A) sim1a ATG morphant embryos exhibit increased levels of cell death as indicated by acridine orange stains (asterisk) when compared to wild-type controls and embryos injected with the sim1a 5 bp ATG mmMO. (B) Live time course of embryos injected with the sim1a 5 bp ATG mmMO as a control for assessing the specificity of the sim1a translation-targeting MO. Embryo anterior is located to the left in all panels. (C) Graph depicts the mean heartbeats per minute for wild-type (WT) embryos and sim1a ATG morphants at 38, 48, and 72 hpf. Asterisks indicate the degree of significance: p<0.05*, 0.01**, 0.001***. Abbreviations: bp – base pair; hpf – hours post fertilization; mmMO – mismatch morpholino; MO – morpholino; WT – wild-type. |
|
Knockdown of sim1a leads to nephron segmental defects and the loss of the CS. sim1a morphants were screened by WISH at 24 hpf for changes in nephron segmentation. Embryos were assayed with a cocktail of riboprobes to simultaneously detect multiple or single pronephric segments (purple). (A) A mixture of wt1b, slc20a1a and slc12a1 labeled the podocytes, the PCT, and DE, respectively. A single riboprobe was used to directly label the PST (trpm7). (B) WISH analysis of stc1 expression (purple) was performed on sim1a morphants at different time points. Somites are stained in red indicating smyhc1 transcripts. Black bars represent segment domains in correlation to somite numbers. Embryo anterior is to the left in all panels. Abbreviations: CS – corpuscles of Stannius; hpf – hours post fertilization; WISH – whole mount in situ hybridization. |
|
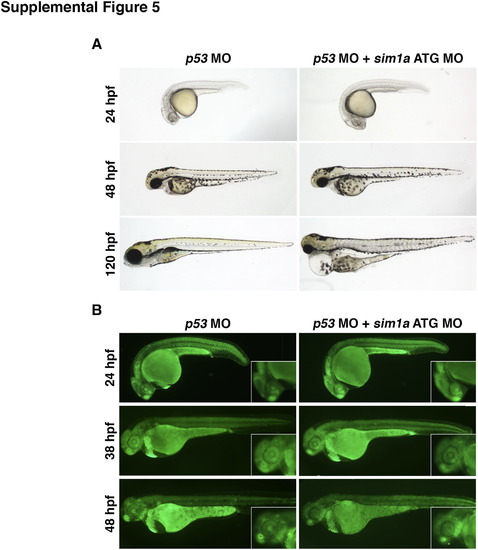
Combined knockdown of p53 and sim1a partially obviates cell death associated with sim1a knockdown. (A) Live time course of embryos injected with a p53 MO or p53+sim1a ATG MO. p53 morphants appear morphologically wild-type. Dual p53+sim1a morphants have wild-type features at 24–48 hpf, but develop pericardial edema and have small head and eye phenotypes at 120 hpf. (B) Cell death was assayed by acridine orange staining. p53 morphants exhibit low levels of cell death as indicated. By comparison, p53+sim1a morphants have slightly higher cell death but this was largely reduced compared to sim1a morphants alone (see Fig. S2A). Embryo anterior is located to the left in all panels. Abbreviations: hpf – hours post fertilization; MO – morpholino. |
|
Nephron segmentation analysis in p53 morphants and after dual genetic knockdown of p53+sim1a reveals a role for cell death in embryonic renal development. (A) Segmentation patterning changes within the pronephros of wild-types, p53 morphants, sim1a ATG morphants, and combined p53+sim1a morphants were independently assessed. WISH of embryos at 24 hpf indicates the expression of specific kidney segment markers (purple) in relation to the smyhc1-expressing somites (red). Black lines with corresponding somite numbers indicate segment domains. Embryo anterior is to the left in all panels. (B) Diagram indicates the dominant segmentation phenotypes displayed by wild-type control embryos and the various morphants at 24 hpf. Colored bars indicate the respective domains of each nephron segment in relation to the somite numbers located above. The striped region of PCT/PST within the colored bars indicates an area with lower as well as variable transcript expression. Abbreviations: CS – corpuscles of Stannius; DE – distal early; DL – distal late; hpf – hours post fertilization; MO – morpholino; PCT – proximal convoluted tubule; PST – proximal straight tubule; WISH – whole mount in situ hybridization. |
|
sim1a overexpression is sufficient to partially rescue morpholino mediated sim1a deficiency. WISH analysis at 24 hpf of (A) wild-type control embryos, sim1a ATG morphants, sim1a ATG morphants co-injected with 200 pg of sim1a cRNA, or sim1a splice morphants co-injected with 200 pg of sim1a cRNA. Morphants (sim1a ATG or splice MO) that received sim1a cRNA showed a partial reduction in the PCT (slc20a1a) compared to sim1a morphants, but the PST (trpm7) was still abrogated. The distal tubule (clcnk) in these morphants was remained unchanged compared to the wild-type embryos. WISH analysis of (B) sim1a ATG morphants coinjected with 36 pg of sim1a cRNA showed a partial rescue of the CS (stc1) compared to sim1a ATG morphants. For all panels, renal marker expression (purple) and somite labeling by smyhc1 expression (red) are indicated. Black lines indicate segment domains in relation to corresponding somite numbers. Abbreviations: cRNA – capped RNA; CS – corpuscles of Stannius; DE – distal early; DL – distal late; hpf – hours post fertilization; PCT – proximal convoluted tubule; PST – proximal straight tubule; WISH – whole mount in situ hybridization. |
|
The inhibition of RA biosynthesis through DEAB exposure in wild-type embryos leads to abnormal nephron segmentation. (A) Diagram of the genomic sim1a locus, with the sim1a coding region and 52 upstream sequence including a putative RARE element. (B) Wild-type embryos were treated from 75% epi to 5–7 ss with DMSO vehicle alone as the control or 1.67×10⁵ M DEAB. WISH analyses were performed to label pan-proximal (nbc1) or CS (stc1) kidney domains (purple), and somite labeling by smyhc1 expression (red), at different time points. Black lines indicate segment domains with respect to somite numbers. Embryo anterior is to the left. Abbreviations: CS – corpuscles of Stannius; DEAB – 4-diethylaminobenzaldehyde; epi – epiboly; RA – retinoic acid; RARE – retinoic acid response element; ss – somite stage; WISH – whole mount in situ hybridization. |
Reprinted from Developmental Biology, 399(1), Cheng, C.N., Wingert, R.A., Nephron proximal tubule patterning and corpuscles of Stannius formation are regulated by the sim1a transcription factor and retinoic acid in zebrafish, 100-16, Copyright (2015) with permission from Elsevier. Full text @ Dev. Biol.

