- Title
-
Development of the lateral line canal system through a bone remodeling process in zebrafish
- Authors
- Wada, H., Iwasaki, M., Kawakami, K.
- Source
- Full text @ Dev. Biol.
|
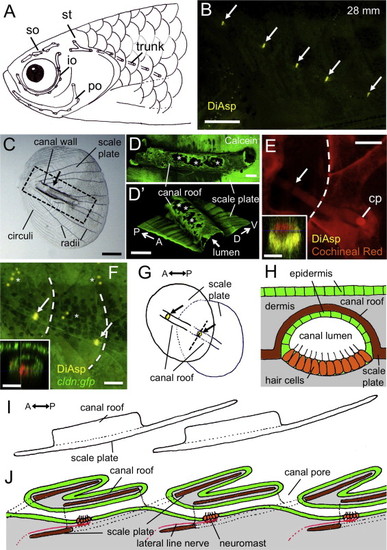
Structure of the lateral line scale in adult zebrafish. (A) Schematic distribution of canals in the UT fish strain, indicating the supraorbital (so), infraorbital (io), preopercular (po), supratemporal (st), and trunk canals. Canals were visualized experimentally by the application of black ink. In 29 out of 60 cases (48%), there were five lateral line scales, as depicted in the diagram. (B) Distribution of trunk canal neuromasts (indicated by arrows) in UT strain fish stained with DiAsp. (C) Structure of lateral line scale. Arrow indicates the position of a canal neuromast. (D and D2) Canal roof stained with Calcein. The region shown corresponds to the dotted line in C. A three-dimensional image is shown in D2. Osteoclast resorption pits are indicated by asterisks. (E and F) Canal structures are visualized with Cochineal Red staining (E), and by using the cldn:gfp line (F). Arrows, canal neuromasts; asterisks, superficial neuromasts; cp, canal pore. Caudal margins of scales are indicated by dotted lines. Optical cross sections at the level of canal neuromasts are shown in insets. (G) Schematic drawing representing a junction of two consecutive lateral line scales. Arrows indicate canal neuromasts. (H) Schematic drawing of the canal structure in cross section at the position of canal neuromasts, as indicated by the dotted line in G. (I) Lateral view showing two consecutive lateral line scales. (J) Schematic drawing of a longitudinal section showing the relationship of the canal lumen to the lateral line scales. Color used in diagrams: green, epidermis; gray, dermis; brown, ossified scale; orange, neuromast hair cells; red, lateral line nerve. Scale bars: 500 μm in B, 100 µm in C, E, and F, 20 μm in D and D2, insets in E and F. |
|
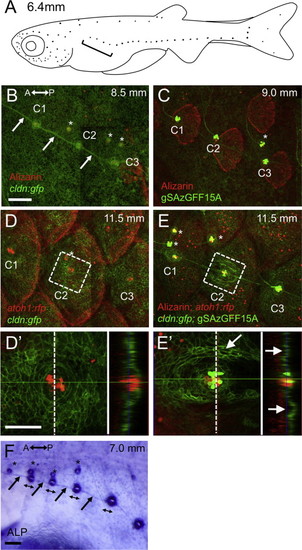
Development of the lateral line scale. (A) Schematic distribution of neuromasts in larval fish, indicated by dots. The first few neuromasts on the anterior trunk region become canal neuromasts (indicated by bracket). (B–E) The first three canal neuromasts (indicated by C1–C3) in larvae stained with Alizarin red at 8.5 mm SL (cldn:gfp, B), 9.0 mm SL (gSAzGFF15A; UAS:gfp, C), and 11.5 mm SL (cldn:gfp; atoh1:rfp, D, cldn:gfp; atoh1:rfp; gSAzGFF15A; UAS:gfp, E). The atoh1:rfp and gSAzGFF15A enable visualization of hair cells. (D2 and E2) Higher magnification of the area shown in D and E, with optical cross sections shown in the right panels. The first sign of canal formation was detected as a pair of ridges along the lateral line (indicated by arrows in E2). (F) Alkaline phosphatase staining showing anisotropy of the canal neuromasts, and an unlabeled central region of neuromast elongating along the axis of hair cell polarity (indicated by double-headed arrows). Arrows indicate interneuromast cells. Asterisks indicate superficial neuromasts. Lateral views; anterior is to the left. Scale bars: 100 μm in B–F, 50 μm in D2 and E2. |
|
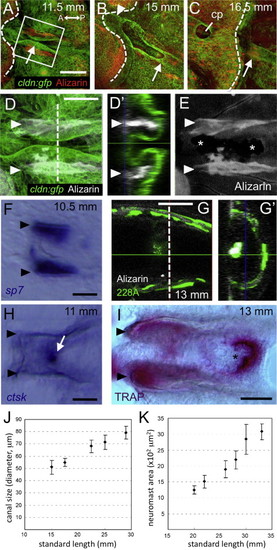
The canal forms through a bone remodeling process. (A–C) Canal structures are imaged in cldn:gfp larvae and juveniles stained with Alizarin red at 11.5 mm SL (A), 15 mm SL (B) and 16.5 mm SL (C). Positions of neuromasts are indicated by arrows. Caudal margins of scales are indicated by dotted lines. (D, D2, and E) Higher magnification images of the area indicated in A, with the red channel converted to white for clarity. Canal walls are lined with dermal bones (indicated by arrowheads). An optical cross section is shown in D2. Resorption pits are visible along the scale plate in E (asterisks). (F) Expression of sp7 gene along the canal walls (indicated by arrowheads). (G and G2) GFP-expressing osteoblasts are associated with the canal roof in SAGFF(LF)228A enhancer trap fish. (H) Expression of ctsk gene along resorption pits (arrow). (I) TRAP activity was detectable along the canal walls and most intensely at the level of resorption pits. (J and K) The canal diameters (J) and neuromast areas (K) were correlated to standard length of fish. Mean±SEM is indicated. Scale bars: 100 μm in A–C, 50 μm in D–I. |
|
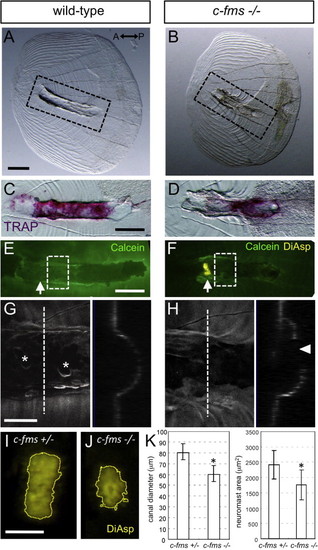
Bone remodeling is required for the normal development of canal structure. (A and B) Images showing disorganization of the canal roof and (C and D) reduced TRAP activity in c-fms/panther fish. Corresponding areas are shown in dotted lines in A and B. (E and F) Removed lateral line scales stained with DiAsp and Calcein. Arrows indicate the positions of canal neuromasts, which was attached to the removed scale in c-fms/panther fish. (G and H) Confocal images of the area indicated by dotted lines in E and F. Optical cross sections are shown in the right panels. Asterisks indicate osteoclast resorption pits on the canal roof, which is not enclosed at the apical region in the c-fms/panther fish (indicated by arrowhead in H). (I and J) Growth of the canal neuromasts was perturbed in the c-fms/panther fish. Canal neuromasts stained with DiAsp were outlined using the “Find Edges” function with ImageJ software. (K) Canal diameter and neuromast area were measured in c-fms/panther fish and heterozygous siblings (28.0–32.0 mm SL). Mean±SEM is indicated. *P<0.001 (t test). Scale bars: 100 μm in A–F, 50 μm in G and I. |
|
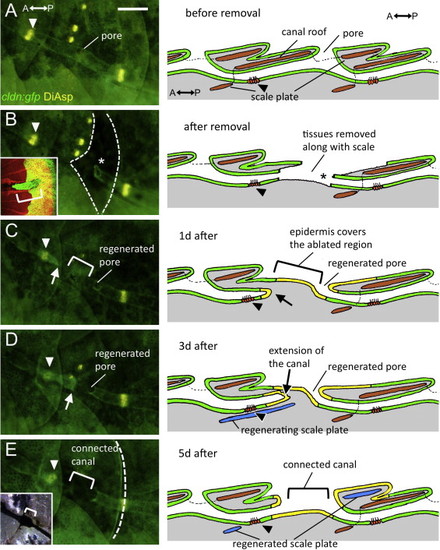
Regeneration of canal structure after removal of a lateral line scale in cldn:gfp fish. Four individuals were examined and showed the same sequence of regeneration. Representative images were taken from the same fish, with the schematic panels on the right representing the process in longitudinal section. (A) Before removal. Arrowhead indicates the canal neuromast corresponding to the scale to be removed. (B) Soon after removal. Dotted lines indicate the area where the skin epidermis was removed along with the lateral line scale. Asterisk indicates the truncated site of the posterior canal epidermis. Inset indicates the removed scale stained with Alizarin red. The posterior half of the canal epidermis was attached to the removed scale (bracket in inset), while the anterior part of canal epidermis including the canal neuromast remained on the body (B, arrowhead). (C) One day after scale removal. The new epidermis spread to heal the wound and a pore was regenerated by the truncated posterior canal epidermis (asterisk). (D) Three days after scale removal. The anterior canal epidermis extended posteriorly (arrow) to the pore region (asterisk). (E) Five days after scale removal. The extended anterior canal epidermis fused to the skin epidermis to connect the canal lumen (bracket). Caudal margin of the regenerated scale is indicated by the dotted line. Black ink was applied to visualize the regenerated canal lumen (inset). Color used in diagrams: green, epidermis; yellow, regenerated epidermis; gray, dermis; brown, lateral line scales; blue, regenerated scale. Scale bar: 100 μm. |
|
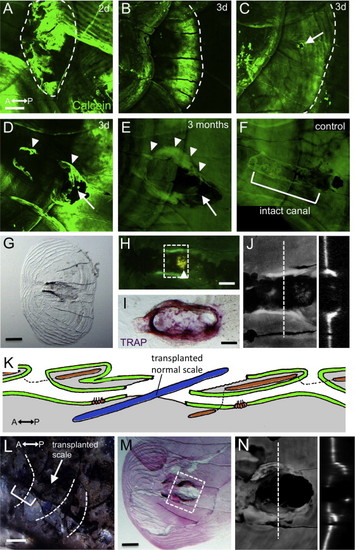
The canal roof was only partly regenerated. (A–F) Fish stained with Calcein at two days (A), three days (C–D), and three months (E) after scale removal. An intact canal roof is shown in F. (G) The regenerated scale was removed and imaged by transmitted light microscopy. (H) Regenerated lateral line scale stained with DiAsp and Calcein, showing the canal neuromast attached to the removed scale. (I) TRAP staining showed abnormal osteoclast activity in the regenerated scale (intact canal is shown in Fig. 5C). (J) Confocal image of the area indicated by dotted lines in H. Optical cross sections are shown in the right panel. (K) Schematic illustration of the scale transplantation experiment. A lateral line scale was replaced by a normal scale (blue). (L) Three months after transplantation, the canal lumens were again connected (bracket) through the transplanted scale (indicated by arrow). (M) The inserted scale was removed and imaged as in G. (N) Confocal image of the area indicated by dotted lines in M. An optical cross sections is shown in the right panel. Scale bars: 100 μm in A–G, L and M, 50 μm in H and I. |
|
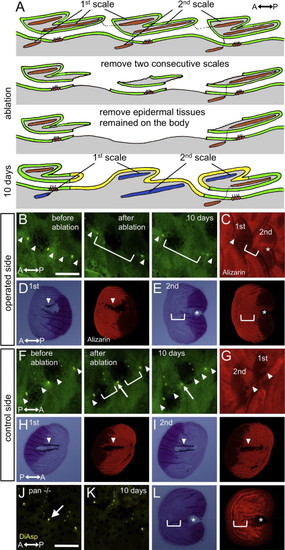
Lateral line cells are required for canal formation. (A) Schematic illustration of the lateral line cell ablation experiments. After removal of two consecutive scales (indicated by 1st and 2nd scales), the epidermal tissues remaining on the body were also removed. These epidermal tissues contain a canal neuromast and interneuromast cells. As a result, the 2nd scale regenerated in the absence of a corresponding canal neuromast. (B) Operated side. The canal epidermis (arrowheads) and a canal neuromast (stained with DiAsp) did not form within the 2nd scale (bracket). (C) The same fish shown in B was stained with Alizarin red. The 1st scale formed canal walls (arrowhead), whereas the 2nd scale could not (bracket). (D and E) The regenerated scales were removed and imaged by transmitted light microscopy. Canal walls and resorption regions were visible in the 1st scale (arrowhead in D), but not in the 2nd scale (bracket in E). Fluorescent images are shown in the right panels. Asterisk in E indicates a pore regenerated by the posterior canal epidermis. (F) Control side. Two consecutive scales (1st and 2nd) were removed. 10 days after removal, the canal epidermis was reconnected (arrowheads). (G) The same fish shown in F was stained with Alizarin red. The regenerated scales formed canal walls (arrowheads). (H and I) The regenerated scales were removed and imaged by transmitted light microscopy. Both 1st and 2nd scales formed canal walls and resorption regions (arrowheads). (J and K) The canal neuromasts did not regenerate by 10 days after scale removal in c-fms/panther fish. (L) The regenerated scale from the c-fms/panther fish also did not form canal walls or resorption regions. Asterisks indicate a pore regenerated by the posterior canal epidermis. Scale bars: 500 μm. |
|
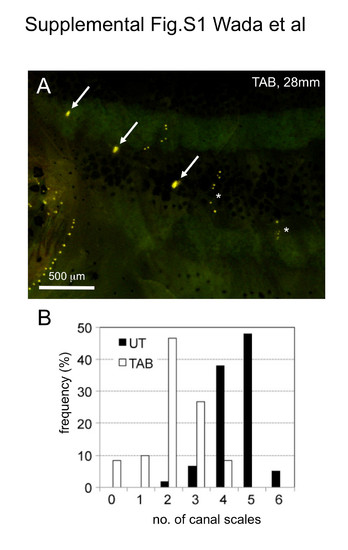
Lateral line scale numbers (i.e., the number of canal neuromasts) differ significantly among zebrafish strains. (A) Distribution of trunk canal neuromasts in the TAB strain stained with DiAsp. Asterisks indicate lines of superficial neuromasts. (B) Difference in numbers of canal scales between UT and TAB strains. Lateral line scales were counted in UT (n = 60, both sides from 30 fish, 28.0-34.0 mm SL) and TAB strains (n = 60, both sides from 30 fish, 27.0-32.0 mm SL). |
|
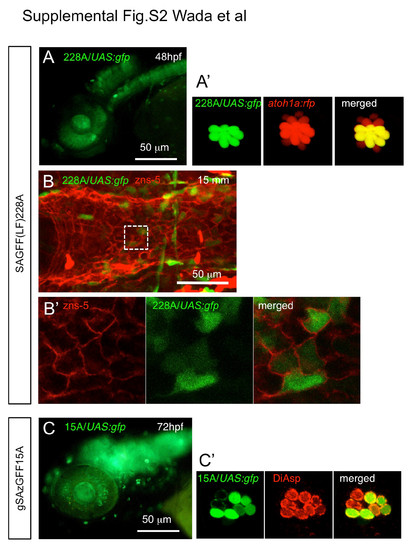
Expression patterns of the Gal4 enhancer trap lines. (A) SAGFF(LF)228A expresses Gal4 in neuromast hair cells, which are co-labeled with atoh1a:rfp in A′. (B) SAGFF(LF)228A expresses Gal4 in scale-forming osteoblasts, which were labeled with the zns-5 antibody (Lee et al., 2013). SAGFF(LF)228A; UAS:gfp larvae (15 mm SL) were immunostained with anti-GFP (green) and zns-5 (red) antibodies, showing colabeling of scale-forming osteoblasts on the canal roof. (B′) Higher magnification of the boxed region in B. (C) gSAzGFF15A expresses Gal4 in neuromast hair cells. GFP was detected in most of the sensory hair cells labeled with DiAsp (C′). |
|
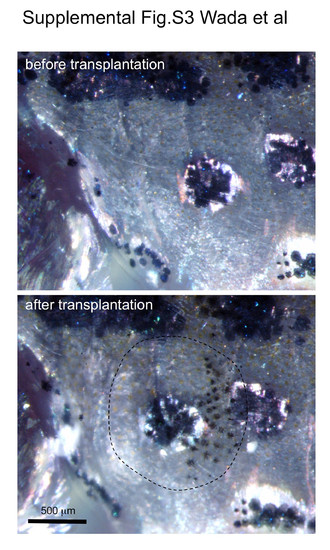
Scale transplantation experiments. First, one dorsal scale and one lateral line scale were removed. The dorsal scale was then inserted into the place where the lateral line scale had just been removed as described previously (Shinya and Sakai, 2011). Dorsal scales contain melanophores, whereas lateral line scales are nonpigmented. Thus we could assess whether the transplanted scale was retained by the presence of pigment cells. The transplanted scale is outlined by the dotted line. Images were taken under light microscopy using epi-illumination. |
|
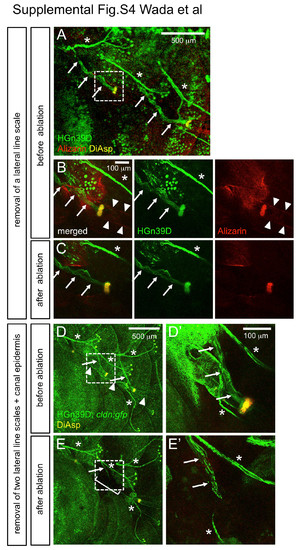
Axonal projections were not affected by scale removal. (A) The lateral line nerves are visualized in HGn39D enhancer trap line (Faucherre et al., 2009) stained with DiAsp and Alizarin red. Branches of lateral line nerves innervating canal neuromasts are indicated by arrows. (B) Higher magnification of the boxed region in A. Arrowheads indicate canal roof stained with Alizarin red. (C) The lateral line scale was removed from the same fish. The canal neuromast and the lateral line nerve remain intact after scale removal. (D) The lateral line nerves and canal epidermis were visualized in HGn39D; cldn:gfp double transgenic fish stained with DiAsp. (E) Two consecutive lateral line scales and the canal epidermis are removed from the same fish (bracket). The lateral line nerve innervating the canal neuromast remains intact near the ablated site. (D′, E′) Higher magnification of the boxed region in D and E. Asterisks indicate the nerves innervating superficial neuromasts. |
|
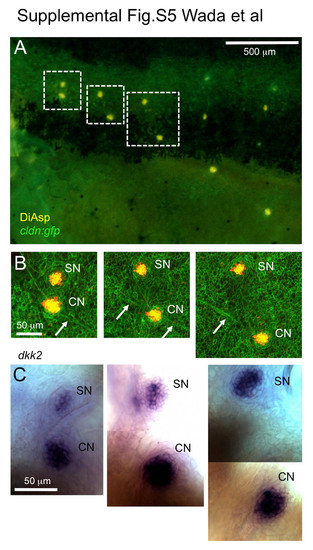
dkk2 is expressed in superficial neuromasts and presumptive canal neuromasts. (A) A 10 mm SL cldn:gfp larva stained with DiAsp. (B) Higher magnification of the boxed region in A. Arrows indicate interneuromast cells. SN, superficial neuromast; CN, canal neuromast. (C) The same larva was stained with a dkk2 RNA probe (Wada et al., 2013). |
|
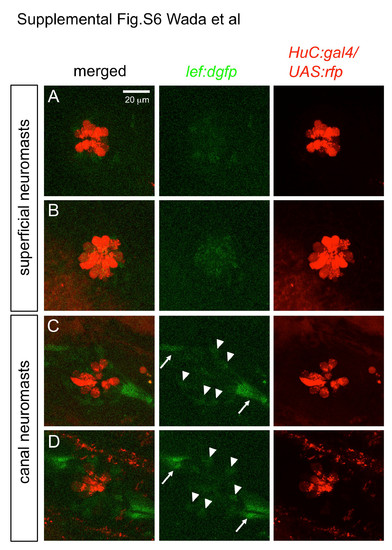
Wnt reporter activity is detectable in canal neuromasts, but not in superficial neuromasts in lef:dgfp line (13-15 mm SL, Shimizu et al., 2012). (A, B) Superficial neuromasts. (C, D) Canal neuromasts. Hair cells were visualized in the HuC:gal4; UAS:rfp transgenic lines (Kimura et al., 2008). Arrowheads indicate lef:dgfp-positive cells within neuromasts. Arrows indicate interneuromast cells, that are also lef:dgfp positive. |
|
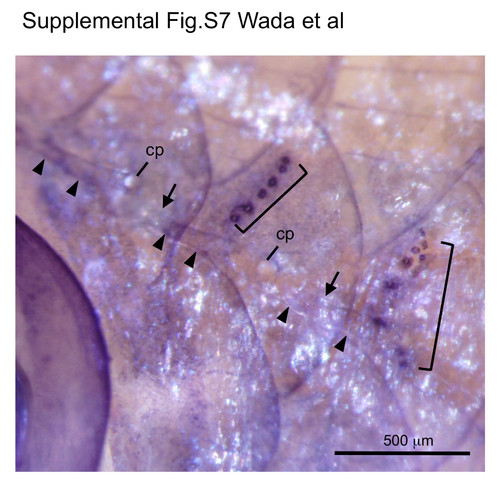
Alkaline phosphatase activity disappears in canal neuromasts. Staining of a 25 mm SL fish for alkaline phosphatase activity (Villablanca et al., 2006) showed strong signal in superficial neuromasts (brackets), but not in canal neuromasts. Positions of canal neuromasts are indicated by arrows. Arrowheads indicate canal roof; cp, canal pore. |
|
|
Reprinted from Developmental Biology, 392(1), Wada, H., Iwasaki, M., Kawakami, K., Development of the lateral line canal system through a bone remodeling process in zebrafish, 1-14, Copyright (2014) with permission from Elsevier. Full text @ Dev. Biol.

