
- Title
-
Mucosal candidiasis elicits NF-κB activation, proinflammatory gene expression and localized neutrophilia in zebrafish
- Authors
- Gratacap, R.L., Rawls, J.F., and Wheeler, R.T.
- Source
- Full text @ Dis. Model. Mech.

Candida albicans infects the swimbladder of juvenile zebrafish. (A–F) Cohorts of 20 AB fish were infected by immersion with C. albicans CAF2-dTomato and imaged by confocal microscopy at 5 dpi (8 dpf). (A) C. albicans immersion, non-infected (NI) with pseudo-coloring; black outline of the swimbladder; blue: swimbladder air bubble; red: fluid filled regions, anterior with pneumatic duct and posterior; yellow: intestinal tract with red-fluorescent C. albicans. (B) Level of infection at 5 dpi, low-level infection (Lo; 1 to 20 yeasts), high-level infection (Hi; over 20 yeast cells) and combination of both. Left is a stacked chart depicting the overall percentage of infected fish, divided by intensity of infection. Right shows the mean and standard errors for nine independent experiments. (C–F) Representative images of different levels of infection after C. albicans immersion: (C) low-level infection; (D,E) high-level infection, with (D) inflated and (E) non-inflated swimbladder. Animated z-stack of panel D is shown in supplementary material Movie 1. (F) Magnification of panel D (white box). Scale bars: 100 μm (A,C–E) and 20 μm (F); maximum projection slices n=16 for all images. (G) Level of inflation of the swimbladder in different groups. Average and standard error of ten independent experiments are shown. One-way ANOVA and Bonferroni post-hoc test; *P<0.05. Data are representative of at least three independent experiments. |

NF-κB is highly activated in epithelial cells in vivo in high-level infection. (A–E) Cohorts of twenty NFκB:EGFP fish were infected by immersion with C. albicans CAF2-dTomato and imaged by confocal microscopy at 5 dpi. (A–C) In vivo expression of GFP in high-level-infected (A) and uninfected (B) swimbladder; yellow arrows indicate the epithelial layer. (C) Magnification of image A (white box), with C. albicans inside a phagocyte (white arrows). (D,E) Ex vivo dissected swimbladder expression of EGFP from high-level infected zebrafish (D) with highlighted epithelial (green arrow towards green box) and mesothelial (black arrow towards gray box) layers and uninfected swimbladder (E). Scale bars: 100 μm (A,B,D,E) and 20 μm (C). Maximum projections of n slices: n=8 for A and B, n=1 for C–E. Images are representative of four independent experiments. |

NF-κB is activated in vivo in the swimbladder upon infection and activation is enhanced by interaction of C. albicans with the epithelium. (A–F) Cohorts of 20 NFκB:EGFP fish were infected by immersion with C. albicans CAF2-dTomato and imaged by confocal microscopy at 5 dpi. (A,B) In vivo NF-κB activity in low-level-infected (A) and uninfected (B) swimbladder. (C–F) Ex vivo dissected swimbladder with low-level infection. (C) Fully inflated dissected swimbladder with (D) yeast cell inside a phagocyte (yellow arrow), and (E) partially inflated dissected swimbladder with (F) yeast cells in direct contact with epithelium (white arrow) and inside a phagocyte (yellow arrow). Animated z-stack of panel C is shown in supplementary material Movie 3, and zoomed z-stack is shown in supplementary material Movie 4. Animated z-stack of panel E is shown in supplementary material Movie 5, and zoomed z-stack is shown in supplementary material Movie 6. (D,F) Magnifications of C and E (white boxes). (G) Schematic representation of the epithelial response to the presence of extracellular fungi (E,F) or phagocytosed fungi only (C,D). Presence of extracellular C. albicans and epithelial cell EGFP (green) expression at 37 infection foci was quantified in images from 13 different fish in four independent experiments. There is a significantly higher proportion of cases of detectable EGFP in epithelial cells when there are extracellular fungi present. Fisher’s exact test; *P<0.05. Scale bars: 100 μm (A–C,E) and 20 μm (D,F). Maximum projections of n slices: n=11 (A), n=8 (B,C) and n=1 (D,F). Images are representative of four independent experiments. |

Neutrophils are present at increased levels in swimbladder infection. (A–D) Cohorts of 20 mpx:GFP fish were infected by immersion with C. albicans CAF2-dTomato and imaged by confocal microscopy at 5 dpi. (A,B) Neutrophil accumulation at the site of infection. (A) High-level infection in non-inflated swimbladder; (B) low-level infection in fully inflated swimbladder. Panel on the right is a magnification of red and green channels (white box) showing direct contact between neutrophil and C. albicans (arrows). Animated z-stack of panel A, right, is shown in supplementary material Movie 8. Animated z-stack of panel B, right, is shown in supplementary material Movie 7. (C,D) Non-infected control fish. (C) C. albicans was not added to the media and (D) C. albicans immersion, no infection. (E) Number of neutrophils in the swimbladder per individual fish. Average and standard error of three independent experiments are shown (pooled data). One-way ANOVA and Bonferroni post-hoc test; ***P<0.001; *P<0.05; n.s. non significant. Scale bars: 100 μm (left panel) and 20 μm (right panel) for magnification. Maximum projections of n slices: n=7 (A–D) and n=5 for magnification of A and B. Images are representative of four independent experiments. |

Candida albicans germinates from the swimbladder and invades nearby tissues. AB fish were infected by immersion with FITC-labeled CAF2-dTomato C. albicans and imaged by confocal microscopy at 5 dpi. Filaments derived from FITC-labeled inoculating yeast are dTomato-expressing but not FITC labeled, as new cell wall does not inherit the FITC fluorescence and only the inoculated yeast are green. Scale bar represents 100 μm, maximum projection n=12. An animated Z-stack is shown in supplementary material Movie 8. |
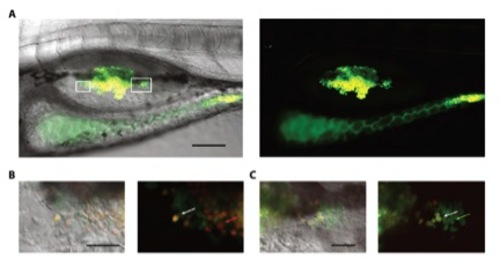
C. albicans can both proliferate and be killed in the swimbladder. (A-C) AB fish were infected by immersion with FITClabeled C. albicans and imaged by confocal microscopy at 5 dpi. Live cells from the inoculum are red in the cytosol and green in the cell wall, dead cells are green only and newly divided cells are red only. (A) In vivo high-level infection. (B) Magnification of A (left box) with live cells from the inoculum (white arrow) and newly divided cells (red arrow). (C) Magnification of A (right box) with live cell (white arrow) and dead cells (green arrow). Scale bars represent 100 μm (A) and 10 μm (B and C), maximum projection n=14 for A and n=1 for B and C. Images are representative of 3 independent experiments. |