- Title
-
A Splice Site Mutation in Laminin-alpha2 Results in a Severe Muscular Dystrophy and Growth Abnormalities in Zebrafish
- Authors
- Gupta, V.A., Kawahara, G., Myers, J.A., Chen, A.T., Hall, T.E., Manzini, M.C., Currie, P.D., Zhou, Y., Zon, L.I., Kunkel, L.M., and Beggs, A.H.
- Source
- Full text @ PLoS One
|
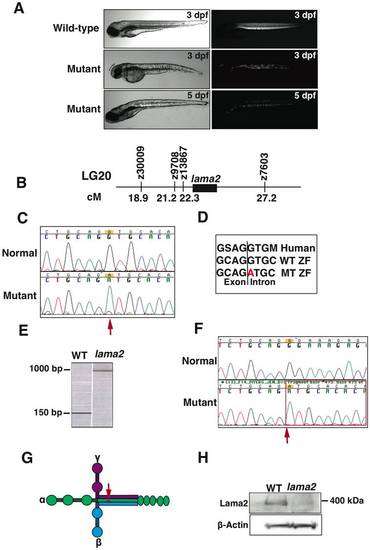
Morphological, genetic and molecular characterization of lama2cl501/cl501 zebrafish. (A) In comparison to the wild-type fish, lama2cl501/cl501 fish exhibit smaller bodies (left panel) and displayed muscle disorganization early in development at 3 dpf (right panel). The muscle degeneration progressed to most of the somites by 5 dpf. (B) Genetic mapping in mutant fish associated the linkage of mutant locus in 4.9 cM region on chromosome 20 in zebrafish identifying lama2 as the candidate gene. (C) Sequencing of lama2 gene in zebrafish identified a mutation at c.5376+1G>A in the mutant fish (arrow). (D) The consensus splice site containing the mutation is highly conserved in human LAMA2 gene. (E) RT-PCR using primers specific for the exons 33 and 34 on either side of the mutant intronic sequence showed a larger PCR product (~900 base pairs) in the mutant fish in comparison to the wild-type fish (152 base pairs) suggesting aberrant splicing. (F) Sequencing of the RT-PCR products revealed the retention of 764 base pairs of intron 33 in the mutation fish (arrow). (G) This mutation is localized at the long arm coiled-coil of lama2 protein (arrow) that interacts with β- and γ- laminins to form functional laminin complex (H) Western blotting analysis showed a reduction of laminin-α2 protein in the mutant fish. PHENOTYPE:
|
|
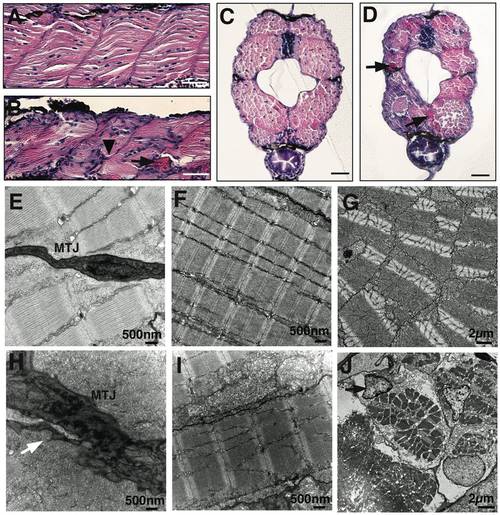
Abnormal myosepta and myofiber detachment in laminin-α2 deficient lama2cl501/cl501 fish. (A & B) Hematoxylin and eosin staining of longitudinal sections of wild-type and lama2 mutant fish at 5 dpf. Mutant muscles showed highly disorganized myofibers in the affected somites with irregular myosepta boundaries (arrowhead) and eosin positive detached myofibers (arrow). (C–D) Cross-sections of wild-type and mutation fish also showed smaller myotome and degenerating muscle fibers in lama2 mutant fish at 5 dpf (arrows), bars = 10 μm. (E & H) Electron microscopy showed myofiber detachment from the myotendinous junction (MTJ) in mutant muscles (arrow). (F & I) The myofibers in wild-type muscles attached tightly to the surrounding fibers while mutant muscle displayed large gaps in the extracellular matrix between adjacent fibers and disorganized Z- lines (black arrow) and M-lines (while arrow). (G & J) Defects in extracellular-matrix results in damaged myofibers in the myotome (cross-section). A large number of apoptotic nuclei were observed in the mutant muscles (J, arrow). |
|
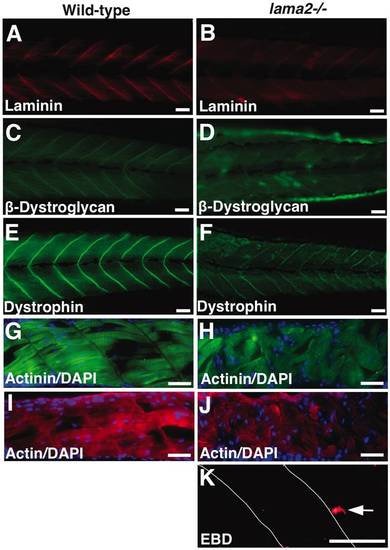
Laminin-α2 deficiency results in severe muscle degeneration. (A–B) Wholemount immunofluorescence analysis showed reduced levels of laminin complex in myotendinous junctions in the mutant muscles. (C–F) The expression of β-dystroglycan as well as dystrophin was also reduced in the mutant muscles. (G–J) Myofibers in wild-type muscles are attached to either side of the myotendinous junctions and displayed well-organized muscles. Mutant fish, however, displayed highly disorganized muscles. Several detached myofibers lacking the contractile proteins are seen in the mutant muscles by α-actinin and sarcomeric actin antibody staining (arrows). (K) Evans blue dye (EBD) injections at 3 dpf detected occasional staining in necrotic fibers (arrow). Bars = 10 μm. |
|
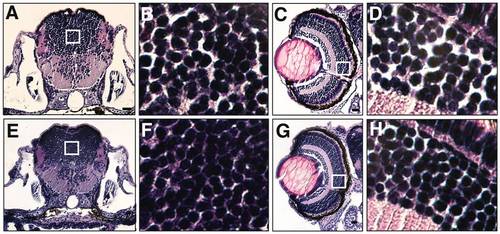
Lama2cl501/cl501 fish exhibit growth abnormalities. (A & E) Histological analysis of cross-section at 7 dpf revealed smaller brain in the mutant fish in comparison to wild-type fish. (B & F) Magnified views of brains showing tightly clumped cells in the mutant brains. (C & G) Wild-type as well as mutant fish displayed well-organized cellular layers in eyes. (D & H) Magnified views of the ganglion cell layer showed tightly organized cells with reduced extracellular space between the cellular layers in mutant fish in comparison to the wild-type. PHENOTYPE:
|

Unillustrated author statements PHENOTYPE:
|


