- Title
-
Characterization of the Regulatory Region of the Zebrafish Prep1.1 Gene: Analogies to the Promoter of the Human PREP1
- Authors
- Bernardi, E., Deflorian, G., Pezzinenti, F., Diaz, V.M., Mione, M., and Blasi, F.
- Source
- Full text @ PLoS One
|
Determination of the Transcription Start Region of human and zebrafish Prep1 genes. A) DNA sequence of the region upstream to the published cDNA sequence (shown in bold). Underlined sequences are the primers employed in the primer extension analysis (Ex1-3, Rev40, Rev10 and Ex-1). The red bold sequence identifies an EGR-1 binding element. The predicted transcription start site (TSS) was identified in this experiment on the basis of the migration of the amplified primers. Below, primer extension analysis using HeLa cells RNA and the primers indicated in A. OX174 lanes show the migration of molecular weight markers (indicated on the side). B) DNA sequence of the zebrafish genomic region which includes a predicted TATA box and TSR of prep1.1 gene. Underlined sequences are the primers used for the RT-PCR assay, F0 to F8 and REV3 (see Table 1). The red bold sequence identifies an EGR-1 binding element. Below, agarose gel electrophoresis of the RT-PCR: F7 identifies the last primer able to amplify, together with REV3, the zebrafish cDNA. |
|
Transient expression of zebrafish prep1.1:GFP promoter constructs in 24 hpf zebrafish embryos. A) Schematic drawing of a 24 hpf zebrafish embryo, in which the main anatomical features are shown. On the same drawing, the transient expression patterns of all the zebrafish promoter contructs used for the analysis are reported: each dot corresponds to a group of GFP-positive cells, whereas each color is related to different promoter region (see map below). This pattern is the result of dozens of observations (see Table 3) manually annotated after each microinjection experiment and stereomicroscope observations. B) For each construct (indicated in the stripe at the top of each figure), a representative image of its transient expression in vivo is shown. Sometimes the entire embryo is shown (in the lateral view), sometimes only the anterior region (in frontal or lateral view). e, eye; Et, intronic enhancer; h, hindbrain; m, midbrain; n, notochord; sc, spinal chord; t, telencephalon; TSS, Transcription Start Site; y, yolk; ye, yolk extension. |
|
GFP is expressed in some gata1-positive cells. Combined in situ hybridization for gata1 (purple) and immunohistochemistry for GFP (dark brown) in 24 hpf embryos injected with the 0.1 Kb promoter constructs (-0.1prep1.1:GFP and -0.1prep1.1-Et:GFP) reveals the co-localization of the two signals in the most of embryo. |
|
Mutation of the EGR-1 binding site abolishes the GFP transient expression due to the 5.0 Kb construct. The nature of the injected construct is indicated in the stripes at the top of each figure (-5.0prep1.1:GFP or -5.0prep1.1mutEGR:GFP). Lateral views of 30 hpf embryos are shown. Below each figure, the sequence of the wild type or of the mutated (in red) EGR-1 binding site is reported. In the most of cases (see also Table 4) the mutation causes the complete abolishment of GFP expression. |
|
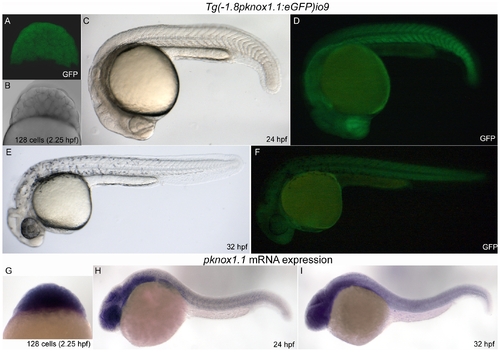
A transgenic fish expressing GFP under the 1.8 Kb zebrafish prep1.1 promoter recapitulates the expression of the endogenous gene during embryogenesis. A–F: live Tg(-1.8pknox1.1:eGFP)io009 embryos of three different developmental stages (indicated) visualized by confocal (A) or fluorescence microscopy (D, F). Embryos in B, C and E are the same of A, D and F respectively, visualized in transmission (A) and bright field (C, E). G, H, I: In situ hybridization of embryos at the same stage of development with the pknox1.1 antisense RNA-probe, shown in lateral view. |
|
In 6 weeks old prep1.1:GFP transgenic fish, the GFP is expressed also in the hematopoietic regions. Cross section, at the level of the trunk, of a juvenile transgenic fish (6 weeks old). A strong expression of GFP was observed in the liver and kidney (the hematopoietic organ in the adult). On the right, the outlined area has been magnified four times and ducts, tubules and hematopoietic cells are indicated. Scale bar: 50 μm. EXPRESSION / LABELING:
|

Unillustrated author statements EXPRESSION / LABELING:
|


