
- Title
-
Movement Directionality in Collective Migration of Germ Layer Progenitors
- Authors
- Arboleda-Estudillo, Y., Krieg, M., Stühmer, J., Licata, N.A., Muller, D.J., and Heisenberg, C.P.
- Source
- Full text @ Curr. Biol.

Movement of Lateral Mesendoderm Cells in Wild-Type Embryos (A and B) Bright-field images of an embryo at the beginning of gastrulation (6.5 hours postfertilization [hpf]; A) and at midgastrulation (8.5 hpf; B). Boxes outline the imaged region in (C). (C) Trajectories of mesendoderm progenitors during midgastrulation stages. Nuclei were tracked with nuclei tracking software [8]. The endpoint of each track is indicated with a sphere. The box depicts the magnified region shown in (D). Embryos were imaged by two-photon excitation microscopy from 6.5 hpf to 8.5 hpf. Animal pole is to the top and dorsal to the right. (D) Magnified view of the boxed region in (C). (E) Average instantaneous speed (inst.), average displacement speed (displ.), and displacement effectiveness of mesendoderm progenitors during midgastrulation stages. (F) Instantaneous similarity of mesendoderm progenitor movements within a maximum distance of 20 μm. Values range from -1.0 (opposite direction of movement) over 0 (movement vectors are orthogonal) to +1 (parallel movement). Histograms were generated separately for each embryo. Box plots show the distribution of the bin heights among the different embryos. |
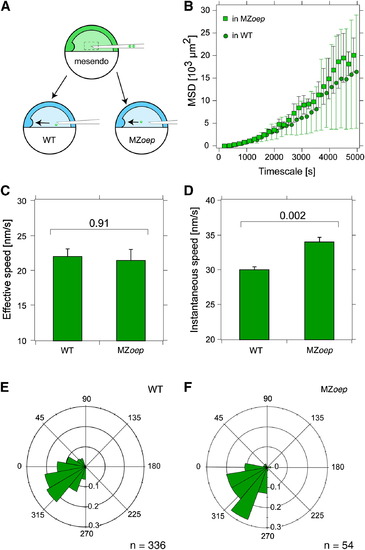
Movement of Individual Mesendoderm Cells in Wild-Type and MZoep Mutant Embryos (A) Schematic diagram of the cell transplantation experiment. One single mesendoderm cell was transplanted from a donor embryo into either wild-type (WT) or MZoep mutant host embryos at the onset of gastrulation (6 hpf). (B) Mean squared displacement (MSD) plot of individual mesendoderm donor cell movements in WT (circles) and MZoep (squares) host embryos. (C and D) Average effective (C) and instantaneous (D) speed of individual mesendoderm donor cell movements in WT and MZoep host embryos. (E and F) Movement orientation of individual mesendoderm donor cells in WT (E) and MZoep (F) host embryos. n represents number of analyzed cells. PHENOTYPE:
|
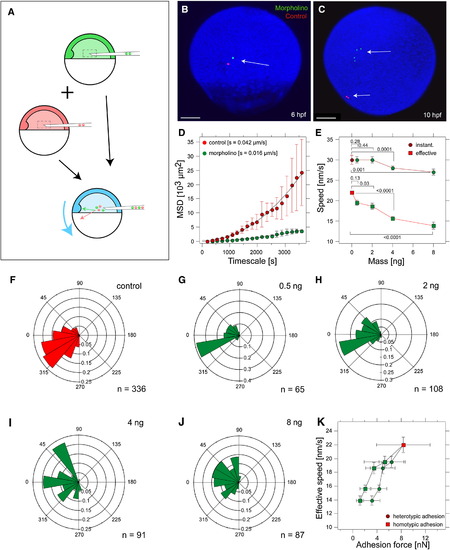
Effect of Cell-Cell Adhesion on Individual Mesendoderm Cell Movement (A) Schematic representation of the transplantation experiment. Cells from donor embryos (red, control; green, e-cadherin morphant) are transplanted into a host WT embryo (blue) at 50% epiboly (5 hpf). The movement of the cells until the end of gastrulation (10 hpf) was monitored by time-lapse confocal microscopy. (B and C) Transplanted e-cadherin morphant (green) and WT control (red) cells at the onset of gastrulation (6 hpf; B) and at the end of gastrulation (10 hpf; C). Arrows point to transplanted cells. (D) MSD plot of e-cadherin morphant and WT control cells. (E) Average instantaneous (circles) and average effective (squares) movement speed for WT control (red) and e-cadherin morphant (green) cells. Error bars represent standard error of the mean. p values determined by t test are shown above or below the brackets. (F–J) Movement orientation of WT control (red; F) and e-cadherin morphant (green) cells injected with 0.5 ng (G), 2 ng (H), 4 ng (I), and 8 ng (J) e-cadherin morpholino (MO) per embryo represented as angular histograms. Angles were calculated with respect to the dorsal-pointing vector originating from the embryo center. n represents number of analyzed cells. (K) Average effective movement speed (mean ± standard error of the mean) as a function of the heterotypic and homotypic adhesion force (median ± MAD) of WT control (red) and e-cadherin morphant (green) cells as measured in Figure 2D (60 s contact time). n represents number of analyzed cells. PHENOTYPE:
|

Movement of Lateral Mesendoderm Cells in e-cadherin Mutant and Morphant Embryos (A–C) Average instantaneous speed (A), average displacement speed (B), and displacement effectiveness (C) of mesendoderm progenitor cell movements during midgastrulation stages (7–9 hpf). Data of 6 wild-type (WT; red), 3 e-cadherin/weg mutant (weg; green), and 4 e-cadherin morphant (ecadMO; green; 4 ng per embryo) embryos are shown. Error bars in (A) and (B) represent the standard error of the mean, and in (C) the standard deviation. p values determined by t test are shown above the brackets. The average number of tracked cells per embryo is 390 ± 169 in WT, 403 ± 213 in mutant, and 380 ± 121 in morphant embryos. (D–F) Instantaneous similarity of neighboring mesendoderm progenitor movements within a maximum distance of 20 μm in WT (D), e-cadherin/weg mutant (E), and e-cadherin morphant (F) embryos. Values range from -1.0 (opposite direction of movement) over 0 (movement vectors are orthogonal) to +1 (parallel movement). Histograms were generated separately for each embryo. Box plots show the distribution of the bin heights among the different embryos. (G) Series of consecutive images from differential interference contrast (DIC) movies showing exemplary mesendoderm progenitor cell couplets in WT (red) and e-cadherin morphant embryos (green; 4 ng MO per embryo) from cell-cell contact formation (-1 min) to contact separation (67 min for WT and 11 min for morphant cells) during their migration at midgastrulation stages (7–9 hpf). Scale bar represents 16 μm. (H) Cumulated histogram of cell contact times of two mesendoderm cells in WT and e-cadherin morphant embryos (4 ng per embryo). Number of interacting cells decreases exponentially with higher contact time. Solid line represents a single-exponential decay with a mean contact survival time t = 12.5 ± 0.3 min and t = 28 ± 1.7 min for morphant (ecadMO) and WT cells, respectively. (I) DIC image outlining the overlap area of representative mesendoderm couplets in WT and e-cadherin morphant embryos (4 ng per embryo). Cell couplets are outlined with a white line and the overlap with a red line. Scale bar represents 18 μm. (J) Overlap area (outlined in I) between two mesendoderm cells in WT and e-cadherin morphant embryos. PHENOTYPE:
|

Antibody Staining Against β-Catenin and E-Cadherin in Wild-Type and e-cadherin Morphant Embryos |