- Title
-
Characterization of rag1 mutant zebrafish leukocytes
- Authors
- Petrie-Hanson, L., Hohn, C., and Hanson, L.
- Source
- Full text @ BMC Immunol.
|
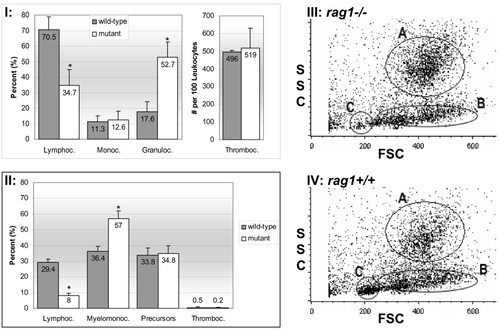
Mutant and wild-type zebrafish leukocyte differentials and flow cytometry scatter plots. I and II represent differential counts on peripheral blood smears and kidney hematopoietic tissue smears, respectively. Asterisks indicate significant difference between wild-type and mutant blood cells within the specific population. Average percentage ± standard deviation from 10 replicates is shown (p ≤ 0.05). III and IV show graphs of flow cytometric results on cells from mutant and wild-type kidney tissues, respectively. Graphs represent pooled data from 4 runs on 4 separate mutant and wild-type fish. Forward scatter (FSC) and side scatter (SSC) analyses of whole kidney cell suspension differentiates three distinct cell populations: A-macrophage/monocytes and granulocytes, B-hematopoietic precursor cells and C-lymphocytes and lymphocyte-like cells. Note the reduction in gate C, characteristic of lymphocytes and lymphocyte-like cells, in mutant kidney cell suspensions. PHENOTYPE:
|
|
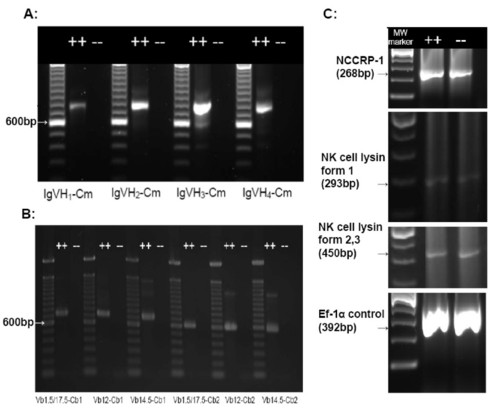
RT-PCR analyses of mutant and wild-type zebrafish kidney hematopoietic tissue. Evaluation of expression of Immunoglobulin (Ig) heavy chain gene rearrangements, T-cell receptor (TCR) β chain rearrangements, NK-Lysin, NCC Receptor Protein-1 (NCCRP-1), and transcription elongation factor 1-α (EF1-α, as a positive control) in mutant and wild-type zebrafish by RT-PCR. (A) Nested RT-PCR using primers spanning VDJ-Cm in Ig VH1-VH4 [16]. (B) Nested RT-PCR using primers spanning TCR V(D)J-Cβ [16]. (C) RT-PCR was used to analyze mRNA expression using primers specific for NCCRP-1, NK lysin form 1, NK lysin forms 2 and 3 and EF1-α (primers are listed in Table 1). All RT-PCR assays included no-RT controls and no product was obtained (data not shown). EXPRESSION / LABELING:
|

Unillustrated author statements PHENOTYPE:
|


