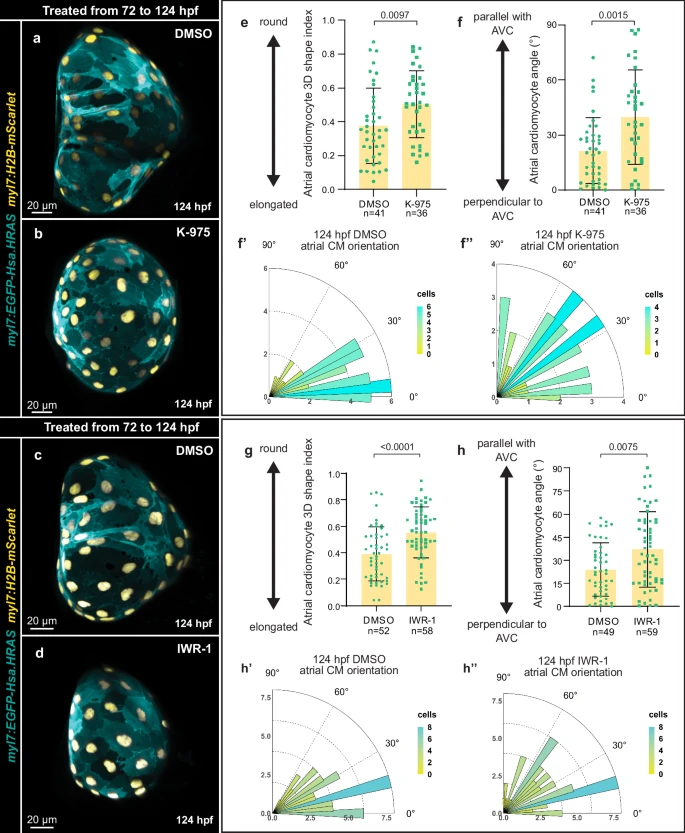
Fig. 5 Hippo pathway inhibition affects atrial cardiomyocyte elongation.a–d 3D airyscan images of atria from 124 hpf larvae treated from 72 to 124 hpf with DMSO (a, c), K-975 (b), or IWR-1(d); CM membranes shown in cyan (myl7:EGFP-Hsa.HRAS) and CM nuclei in yellow (myl7:H2B-mScarlet). e, g 3D quantification of atrial CM shape in 124 hpf larvae treated from 72 to 124 hpf with DMSO, K-975, or IWR-1 (n = 41 atrial CMs from 4 DMSO hearts, n = 36 atrial CMs from K-975 hearts, n = 52 atrial CMs from 5 DMSO hearts, and n = 58 atrial CMs from 5 IWR-1 hearts; each data point represents one atrial CM; average of 10 CMs per heart two-tailed Mann-Whitney test (e); two-tailed unpaired Student’s t-test p-value = 0.48*10-4 (g)). f–f”, h–h”, Atrial CM angle measured in 124 hpf larvae treated from 72 to 124 hpf with DMSO, K-975, or IWR-1 (n = n = 41 atrial CMs from 4 DMSO hearts, n = 36 atrial CMs from 4 K-975 hearts, n = 49 atrial CMs from 5 DMSO hearts, and n = 59 atrial CMs from 5 IWR-1 hearts; each data point represents one atrial CM; average of 10 CMs per heart; two-tailed Mann-Whitney tests). Error bars are mean ± SD.
Image
Figure Caption
Acknowledgments
This image is the copyrighted work of the attributed author or publisher, and
ZFIN has permission only to display this image to its users.
Additional permissions should be obtained from the applicable author or publisher of the image.
Full text @ Nat. Commun.

