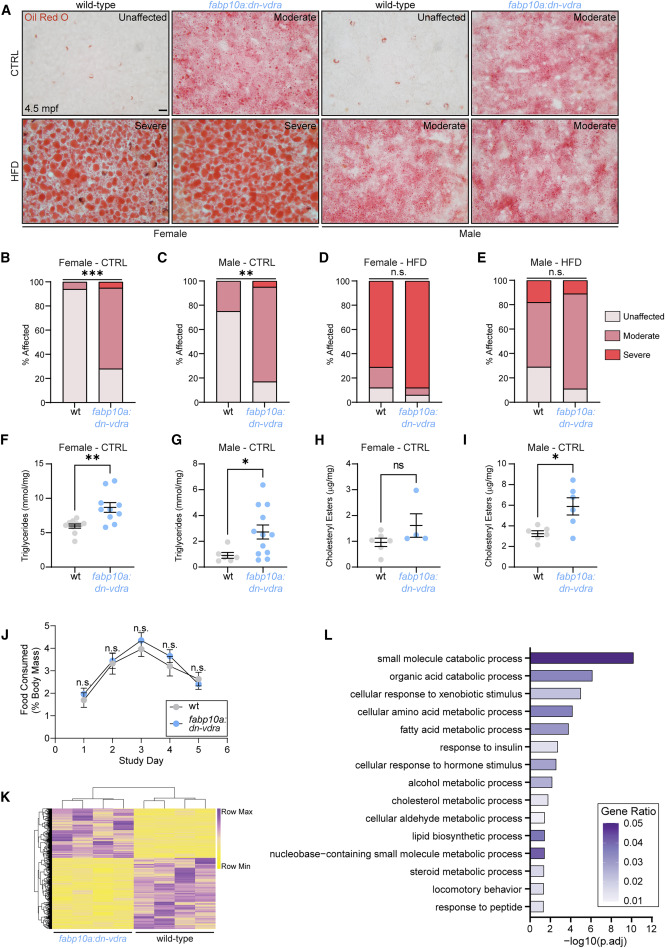
Fig. 5 Loss of hepatocyte Vdr signaling elicits hepatic steatosis in adult zebrafish (A) Oil red O analysis of hepatic steatosis at 4.5 mpf following 8 weeks of CTRL or HFD. Staining severity used for analysis in (B–E) is noted in each image. Scale bar, 10 μm. (B–E) Analysis of oil red O staining severity. Chi-square test. n = 18 WT.CTRL.female, 18 dn-vdra.CTRL.female, 16 WT.CTRL.male, 18 dn-vdra.CTRL.male, 17 WT.HFD.female, 16 dn-vdra.HFD.female, 17 WT.HFD.male, 18 dn-vdra.HFD.male. (F) Triglyceride measurement in CTRL female liver. Each sample represents a single liver. Unpaired two-tailed t test. n = 10 per group. (G) Triglyceride measurement in CTRL male liver. Each sample represents two livers. n = 6 WT, 12 dn-vdra. Unpaired two-tailed t test. (H–I) Cholesteryl ester measurement in CTRL female (H) and male (I) liver. Each sample represents two livers. (H) Unpaired two-tailed t test. n = 6 WT, 4 dn-vdra. (I) Unpaired two-tailed t test. n = 6 per group. (J) Adult food consumption over a 5-day period expressed as a fraction of fish weight. Two-way ANOVA with Sidak’s multiple comparison test. n = 6 males, 6 females per group. (K) Heatmap of differentially expressed genes in fabp10a:dn-vdra adult liver (4.5 mpf). Wald test with false discovery rate adjustment (padj < 0.05). Each sample represents RNA from 3 pooled livers. n = 4 per group. (L) ClusterProfiler overrepresentation analysis of differentially expressed genes identified by RNA sequencing. GeneRatio is the fraction of differentially expressed genes that belong to a given gene set divided by the total number of genes belonging to that gene set. Error bars are mean + SEM. ∗p < 0.05, ∗∗p < 0.01, ∗∗∗p < 0.001. See also Figure S5 and Table S7 .
Image
Figure Caption
Acknowledgments
This image is the copyrighted work of the attributed author or publisher, and
ZFIN has permission only to display this image to its users.
Additional permissions should be obtained from the applicable author or publisher of the image.
Full text @ Cell Rep.

