
Image
|
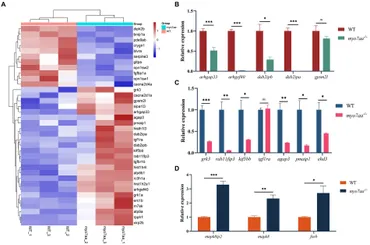
Figure Caption
Fig. 5 myo7aa regulates G-protein signaling. (A) The gene heatmap is depicted in (A), while (B–D) display the relative expression of genes in the Rho GTPase signaling pathway (B), cellular endocytosis pathway (C), and MAPK signaling pathway (D) between WT and myo7aa−/− at 3 dpf, *p < 0.05, **p < 0.01, ***p < 0.001 (t-test).
Acknowledgments
This image is the copyrighted work of the attributed author or publisher, and
ZFIN has permission only to display this image to its users.
Additional permissions should be obtained from the applicable author or publisher of the image.
Full text @ Front. Mol. Neurosci.