
Image
|
Figure Caption
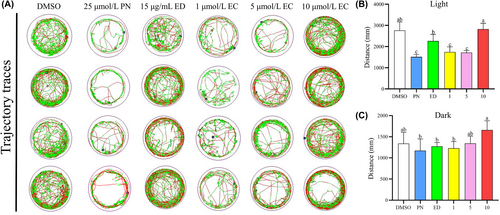
Fig. 5 Neurobehavioral changes in zebrafish larvae induced by different EC concentrations (n = 4). (A) Representative trajectory traces of 9 dpf zebrafish larvae in six exposure groups for a continuous period of 30 minutes. (B) Total distances moved by 9 dpf zebrafish larvae during the light cycle. (C) Total distances moved by 9 dpf zebrafish larvae during the dark cycle. Different letters above the error bars indicate significant differences (p < 0.05) among the groups.
Acknowledgments
This image is the copyrighted work of the attributed author or publisher, and
ZFIN has permission only to display this image to its users.
Additional permissions should be obtained from the applicable author or publisher of the image.
Full text @ J. Cell. Mol. Med.