Image
Figure Caption
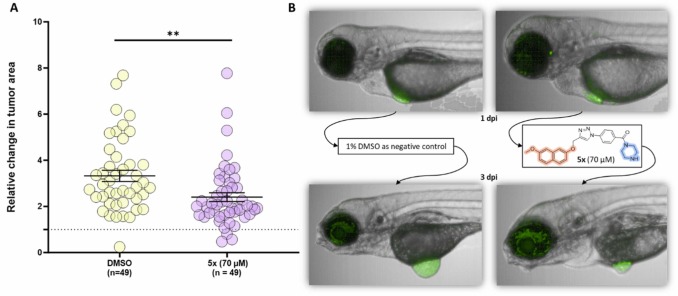
Fig. 10 A) Graph depicting a statistically significant difference in relative change in tumour size in larvae treated with 1 % DMSO vs. 70 µM of 5x; Error bars represent SEM. Statistical analysis was performed with a Kolmogornov-Smirnov test (**p<0.01) B) Comparison of representative pictures of zebrafish larvae which show an apparent increase in tumour size with 1 % DMSO (1 dpi vs. 3 dpi), while the increase in tumour volume is much smaller when treated with 5x (70 µM).
Acknowledgments
This image is the copyrighted work of the attributed author or publisher, and
ZFIN has permission only to display this image to its users.
Additional permissions should be obtained from the applicable author or publisher of the image.
Full text @ Biomed. Pharmacother.

