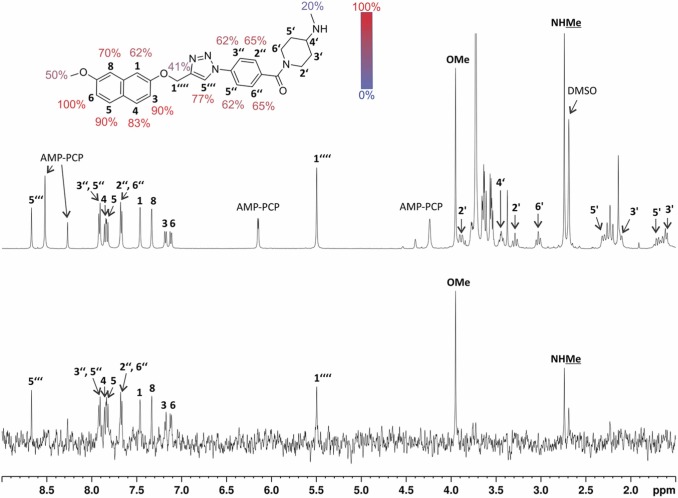
Fig. 6 1D 1H STD NMR spectra for compound 10b recorded at an Hsp90β:ligand ratio of 1:100. The molecular structure illustrates the proton nomenclature and the colour-coded relative degrees of saturation of the individual protons. The STD amplification factors were normalised to the intensity of the signal with the largest STD effect. The reference STD spectrum (top) with proton assignment and the difference STD spectrum (bottom) are shown. The low field signal 6’ is missing due to interference from water suppression. Signals 2’, 3’, 4‘, 5‘, and 6’ have insufficient signal-to-noise ratios in the difference STD spectrum. The unassigned proton signals between 3.5 and 3.8 ppm belong to the protein buffer with glycerol. The spectra are not too scale.
Image
Figure Caption
Acknowledgments
This image is the copyrighted work of the attributed author or publisher, and
ZFIN has permission only to display this image to its users.
Additional permissions should be obtained from the applicable author or publisher of the image.
Full text @ Biomed. Pharmacother.

