
|
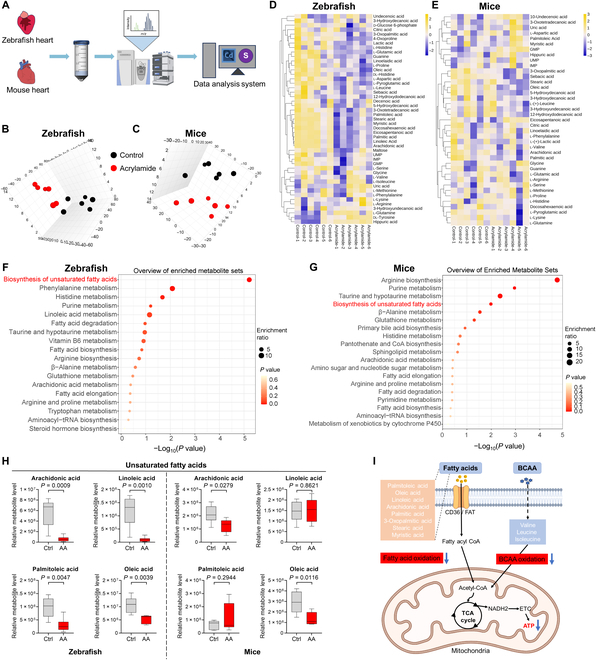
Fig. 4 Chronic exposure to acrylamide induces mitochondria dysfunction and metabolic remodeling based on metabolomics analysis in zebrafish and mice. (A) Schematic diagram of metabolomics for the isolated hearts from both zebrafish and mice. (B and C) 3-dimensional PCA scores plots of metabolites profiles of hearts from zebrafish and mice exposed to acrylamide, respectively (n = 6 per group). (D and E) Heatmap of metabolites based on the normalized mass spectrometry intensity in hearts of zebrafish and mice, respectively. (F and G) KEGG pathway analysis of differential metabolites in hearts of zebrafish and mice, respectively. (H) The relative unsaturated fatty acids levels in hearts of zebrafish and mice, respectively. (I) Model of cardiac mitochondrial energy metabolism disturbance induced by chronic acrylamide exposure. The illustration was created using BioRender. Data are presented as the means ± SEM. Significance was calculated using 2-tailed P values by unpaired Student’s t test. m/z, mass/charge ratio; CoA, coenzyme A; UMP, uridine monophosphate; GMP, guanosine monophosphate; IMP, inosine monophosphate; BCAA, branched-chain amino acid; NADH2, nicotinamide adenine dinucleotide 2; ETC, electron transfer chain; TCA, tricarboxylic acid.