
Image
|
Figure Caption
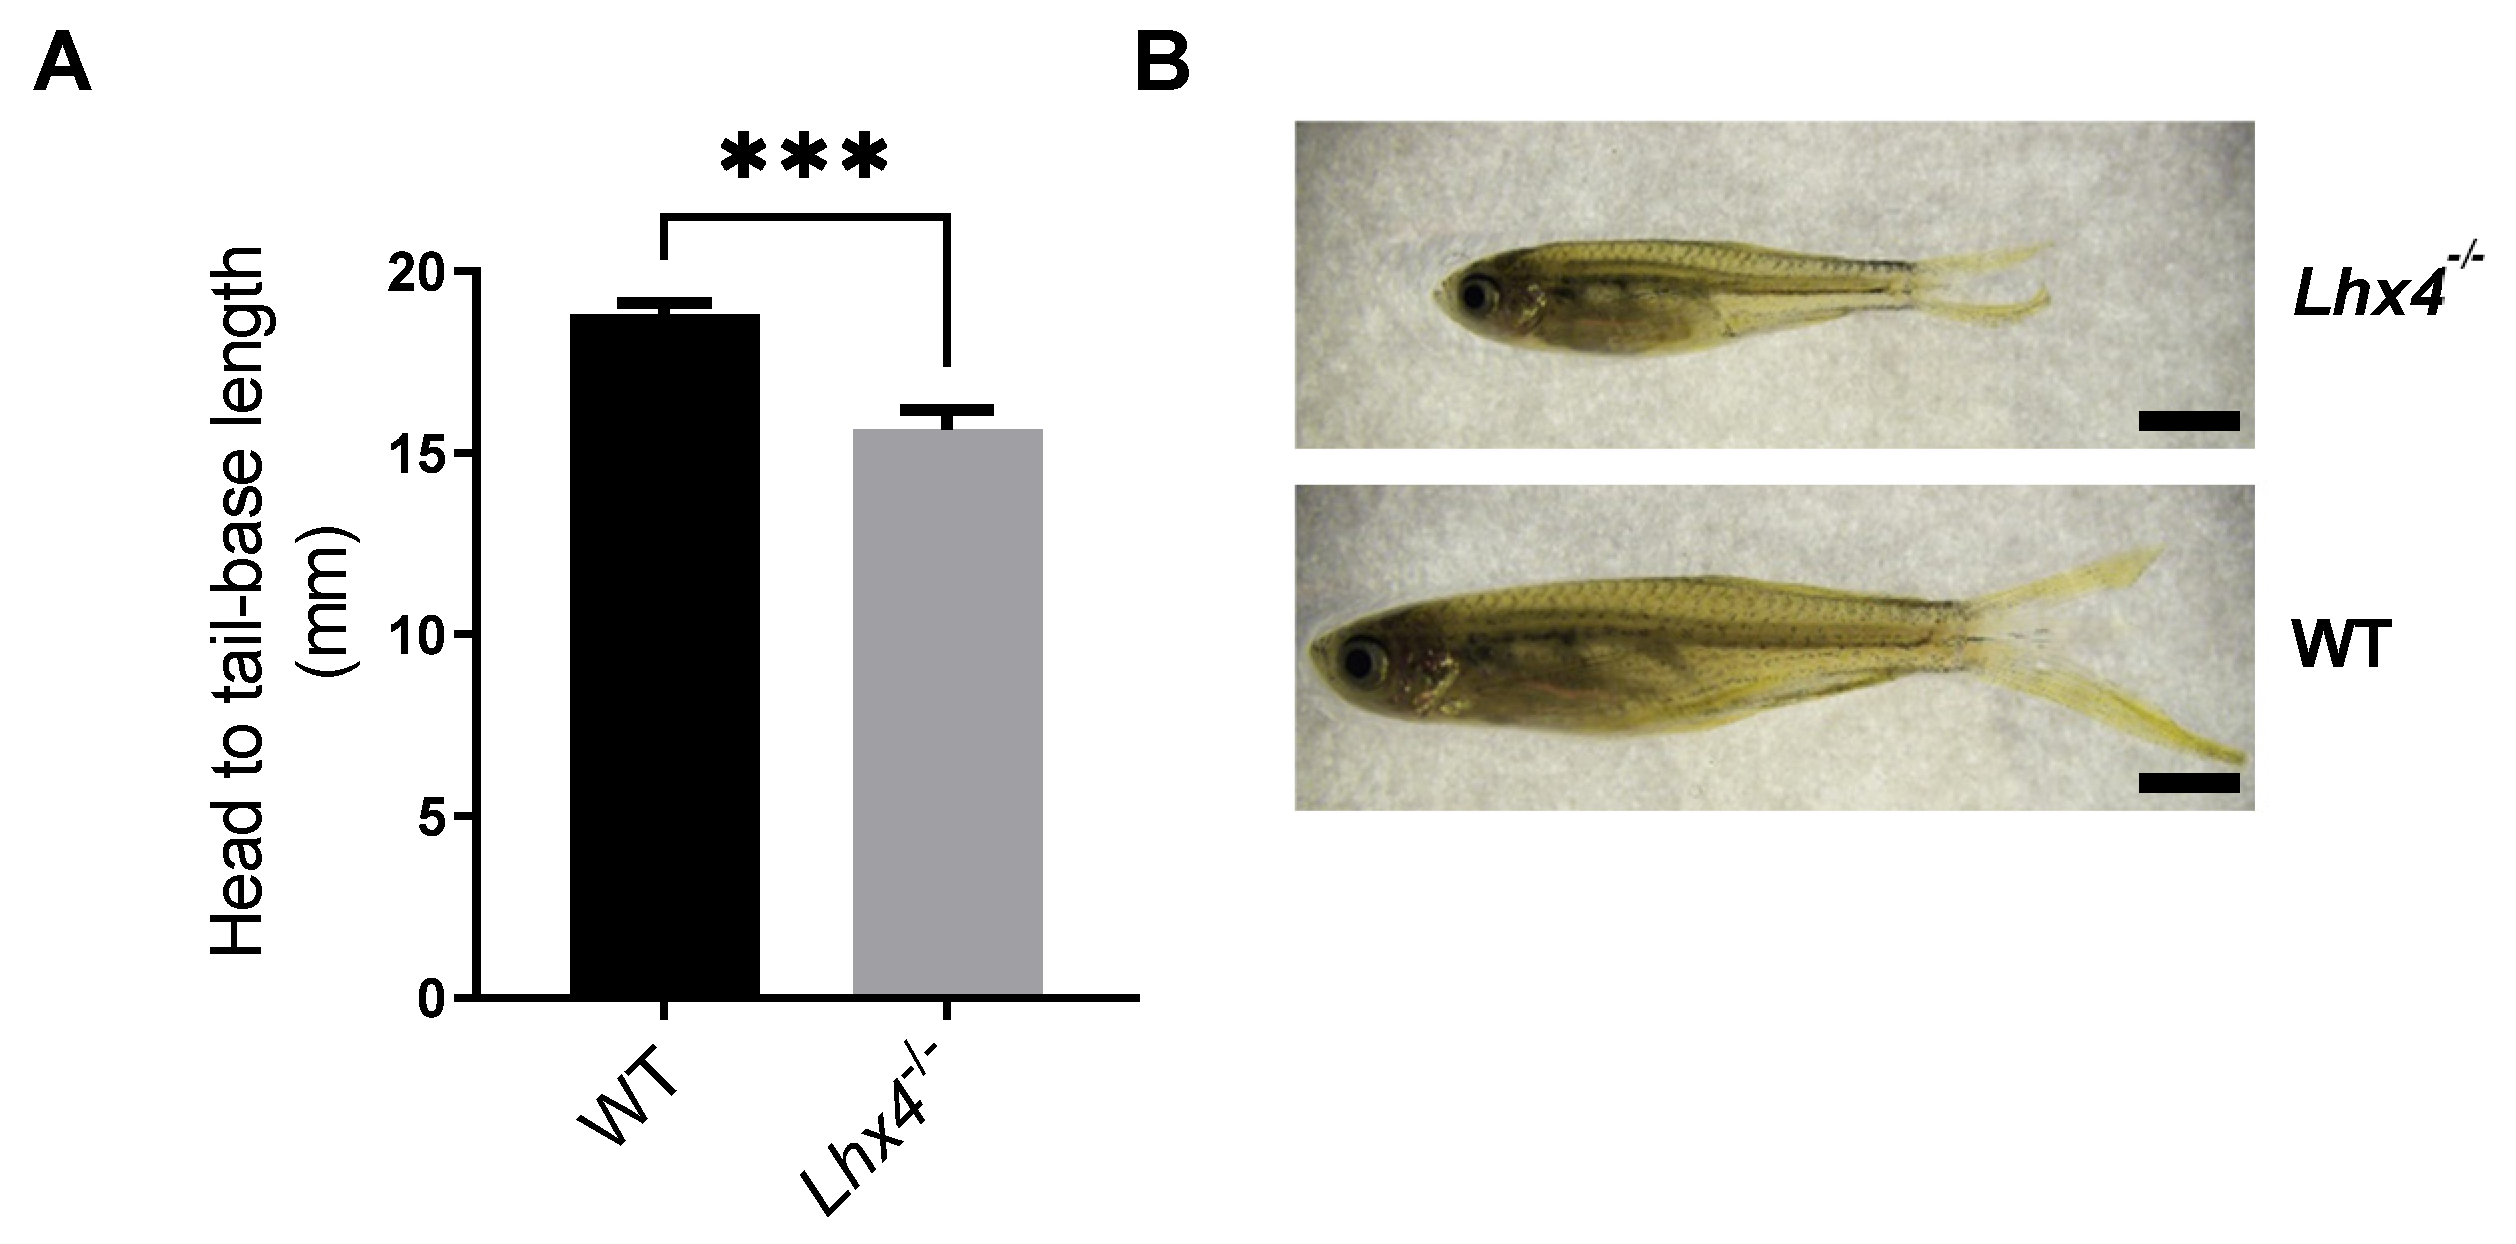
Fig. 4 Reduced body size of adult lhx4 mutants. (A) Bar chart representing head-to-tail-base length (mm) of 5-month-old lhx4-mutant fish and WT siblings that were mutually raised under controlled conditions. Homozygous lhx4 mutants (N = 42) are significantly shorter than their WT siblings (N = 59; *** p < 0.001, Mann–Whitney test). Error bars indicate s.e.m. The presented results were pooled from four independent repeats. (B) Representative adult homozygous lhx4 mutant (top) and WT sibling (bottom), lateral views. Bar scale = 2 mm.
Figure Data
Acknowledgments
This image is the copyrighted work of the attributed author or publisher, and
ZFIN has permission only to display this image to its users.
Additional permissions should be obtained from the applicable author or publisher of the image.
Full text @ Int. J. Mol. Sci.