
|
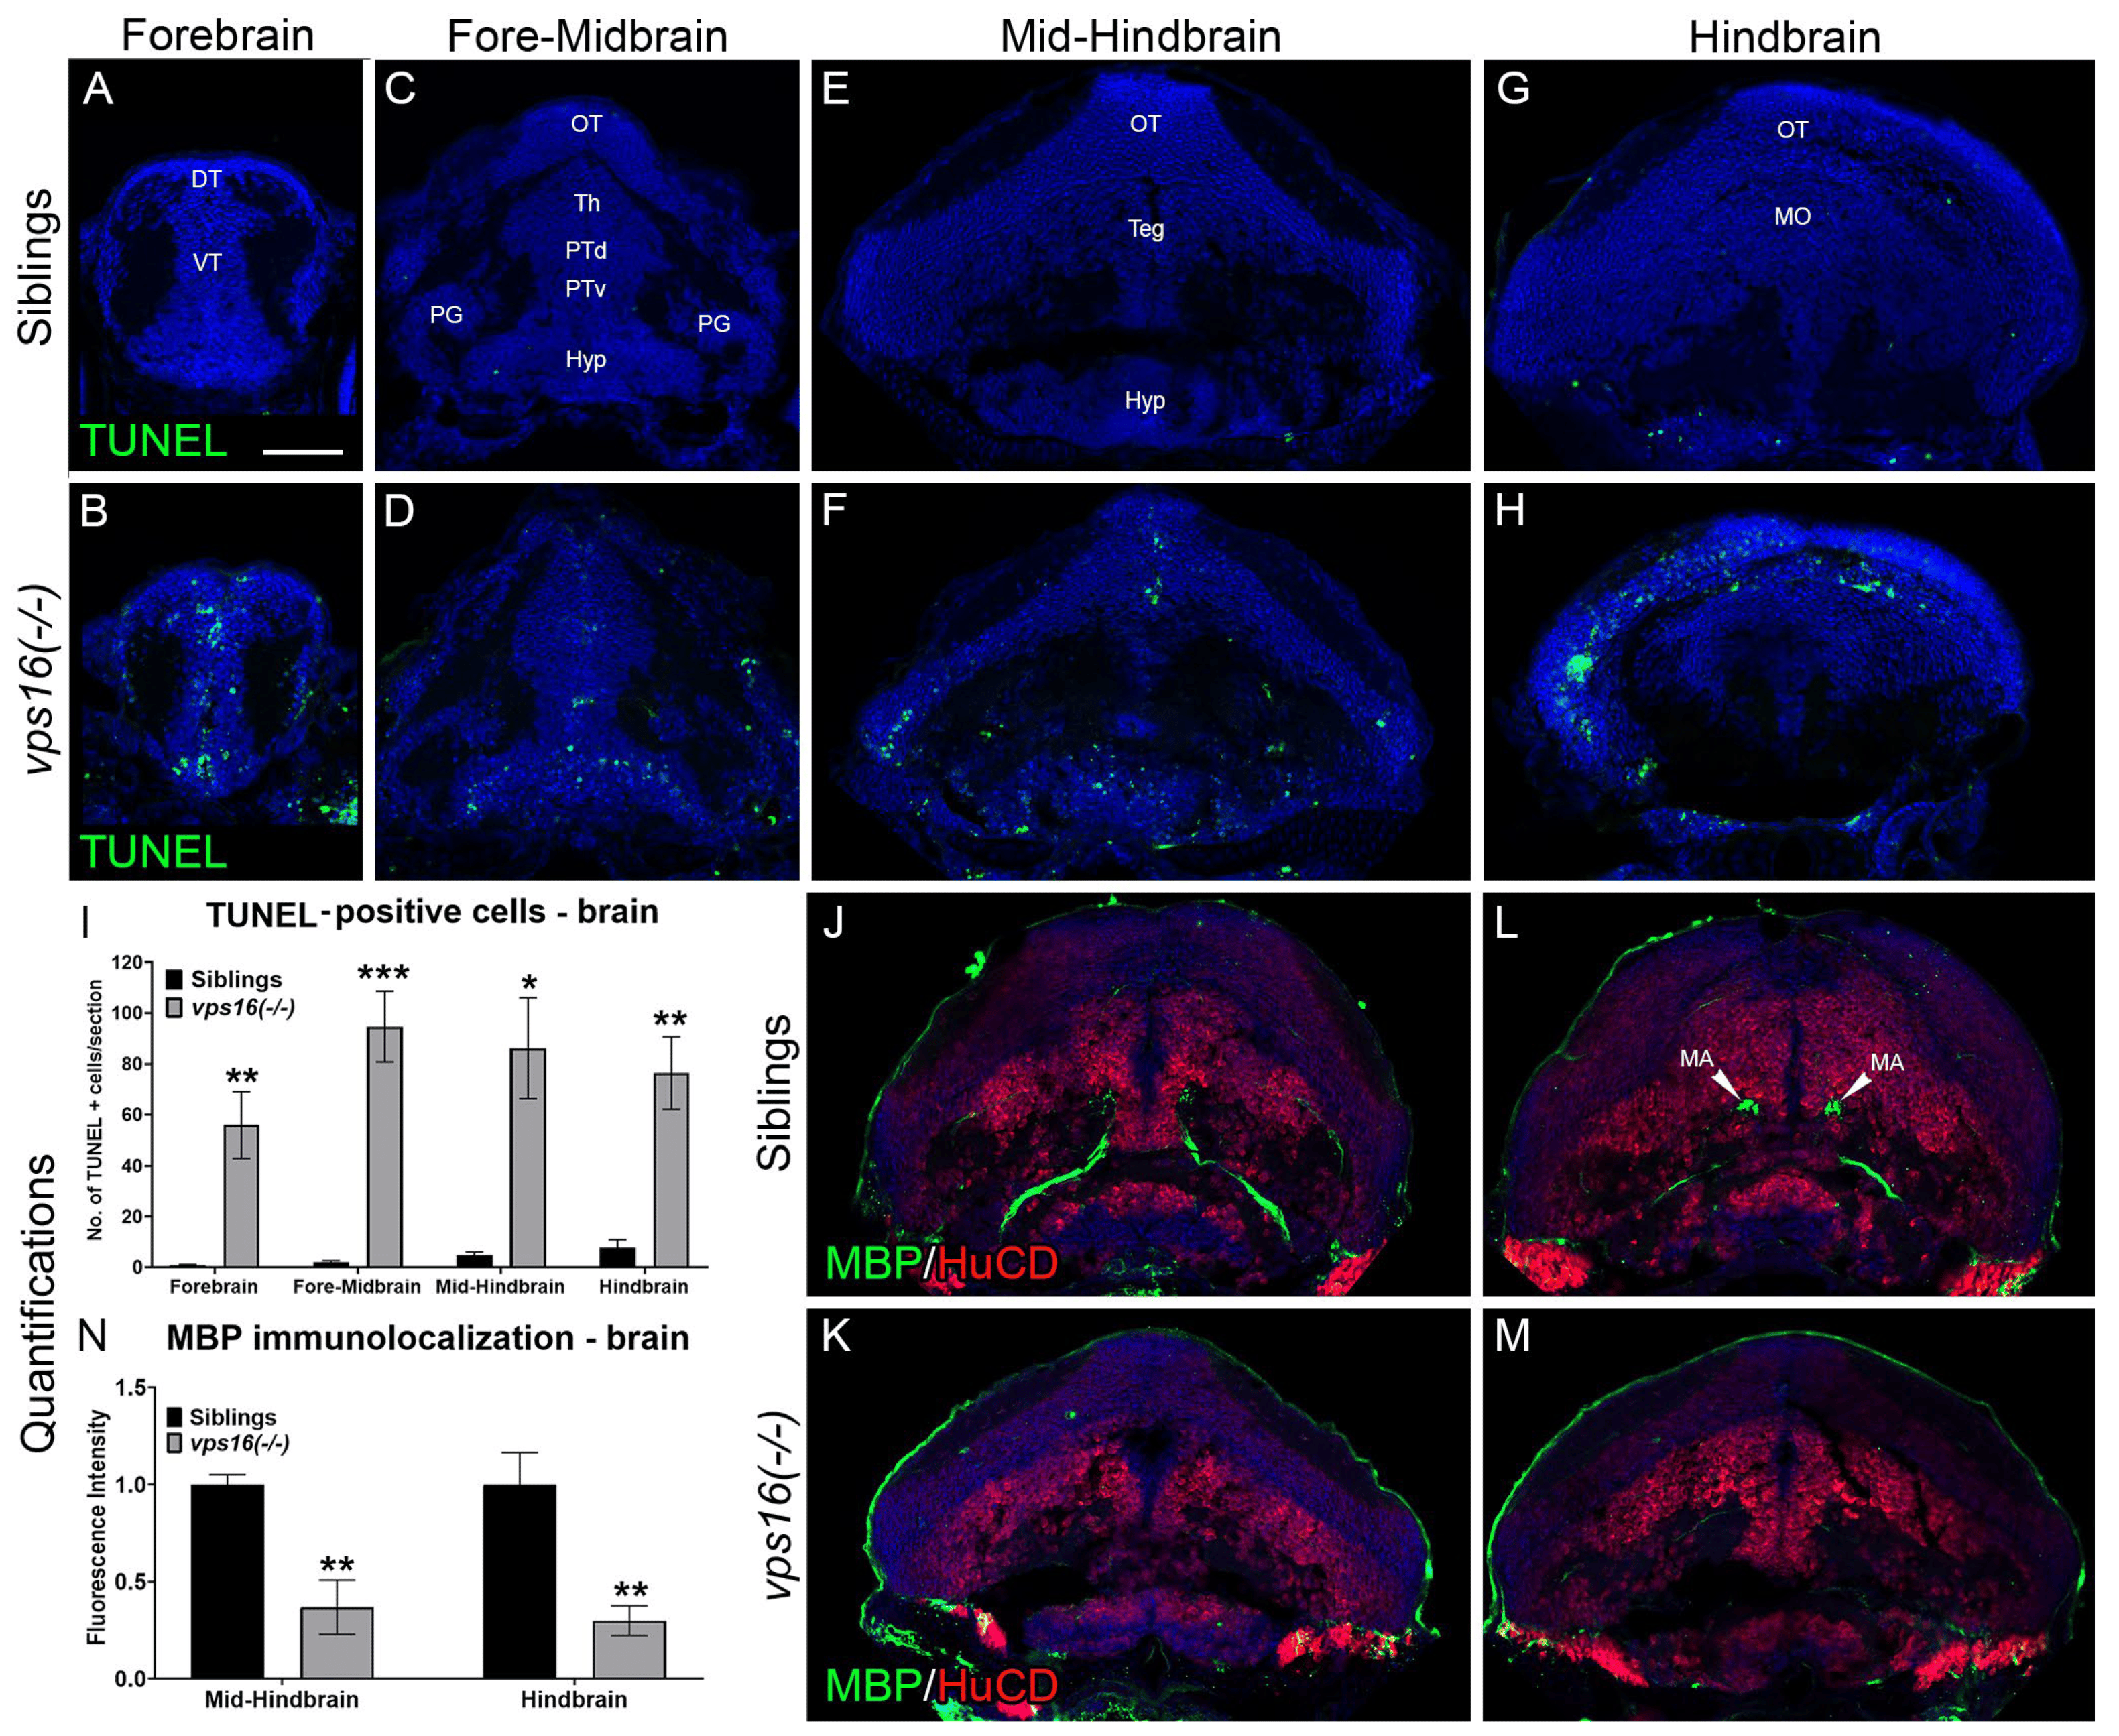
Fig. 3 vps16(-/-) mutants show significant cell death and hypomyelination by 7 dpf. (A–I) TUNEL assay performed on brain sections of 7 dpf sibling and vps16(-/-) mutant larvae. Brain sections identified and sub-categorized in four regions: (A,B) forebrain, (C,D) fore-midbrain, (E,F) mid-hindbrain, and (G,H) hindbrain. (A,C,E,G) Minimal to no TUNEL-positive apoptotic cells (green) seen in sibling brain regions (n: 10 forebrain, 7 fore-midbrain, 9 mid-hindbrain, 4 hindbrain). (B,D,F,H) Numerous TUNEL-positive apoptotic cells (green) seen in vps16(-/-) mutant brain regions (n = 10 forebrain, p = 0.0022; n = 7 fore-midbrain, p = 0.0005; n = 5 mid-hindbrain, p = 0.0146; n = 7 hindbrain, p = 0.0027). (I) Graph representing quantification of average number of TUNEL-positive apoptotic cells in specific brain regions of 7 dpf siblings and vps16(-/-) mutants. (J–N) Immunolocalization of MBP (myelin, green) and HuCD (neurons, red) in brain section from two regions of sibling and vps16(-/-) mutant larvae: (J,K) mid-hindbrain and (L,M) hindbrain. (J–L) MBP immunolocalizes to Mauthner axons in mid-hindbrain (n = 6) and hindbrain (n = 6) regions of sibling brain. (K,M) MBP immunolocalization in mid-hindbrain (n = 6, p = 0.0048) and hindbrain (n = 6, p = 0.0061) regions of vps16(-/-) mutant brain showing decrease in myelin content. (N) Graph representing quantification of MBP immunolocalization in specific brain regions of 7 dpf siblings and vps16(-/-) mutants. Scale bar in panel A = 50 microns for all images. Blue = TO-PRO-3, nuclear stain. Error bars indicate SEM. * p < 0.05, ** p < 0.01, *** p < 0.001.