
|
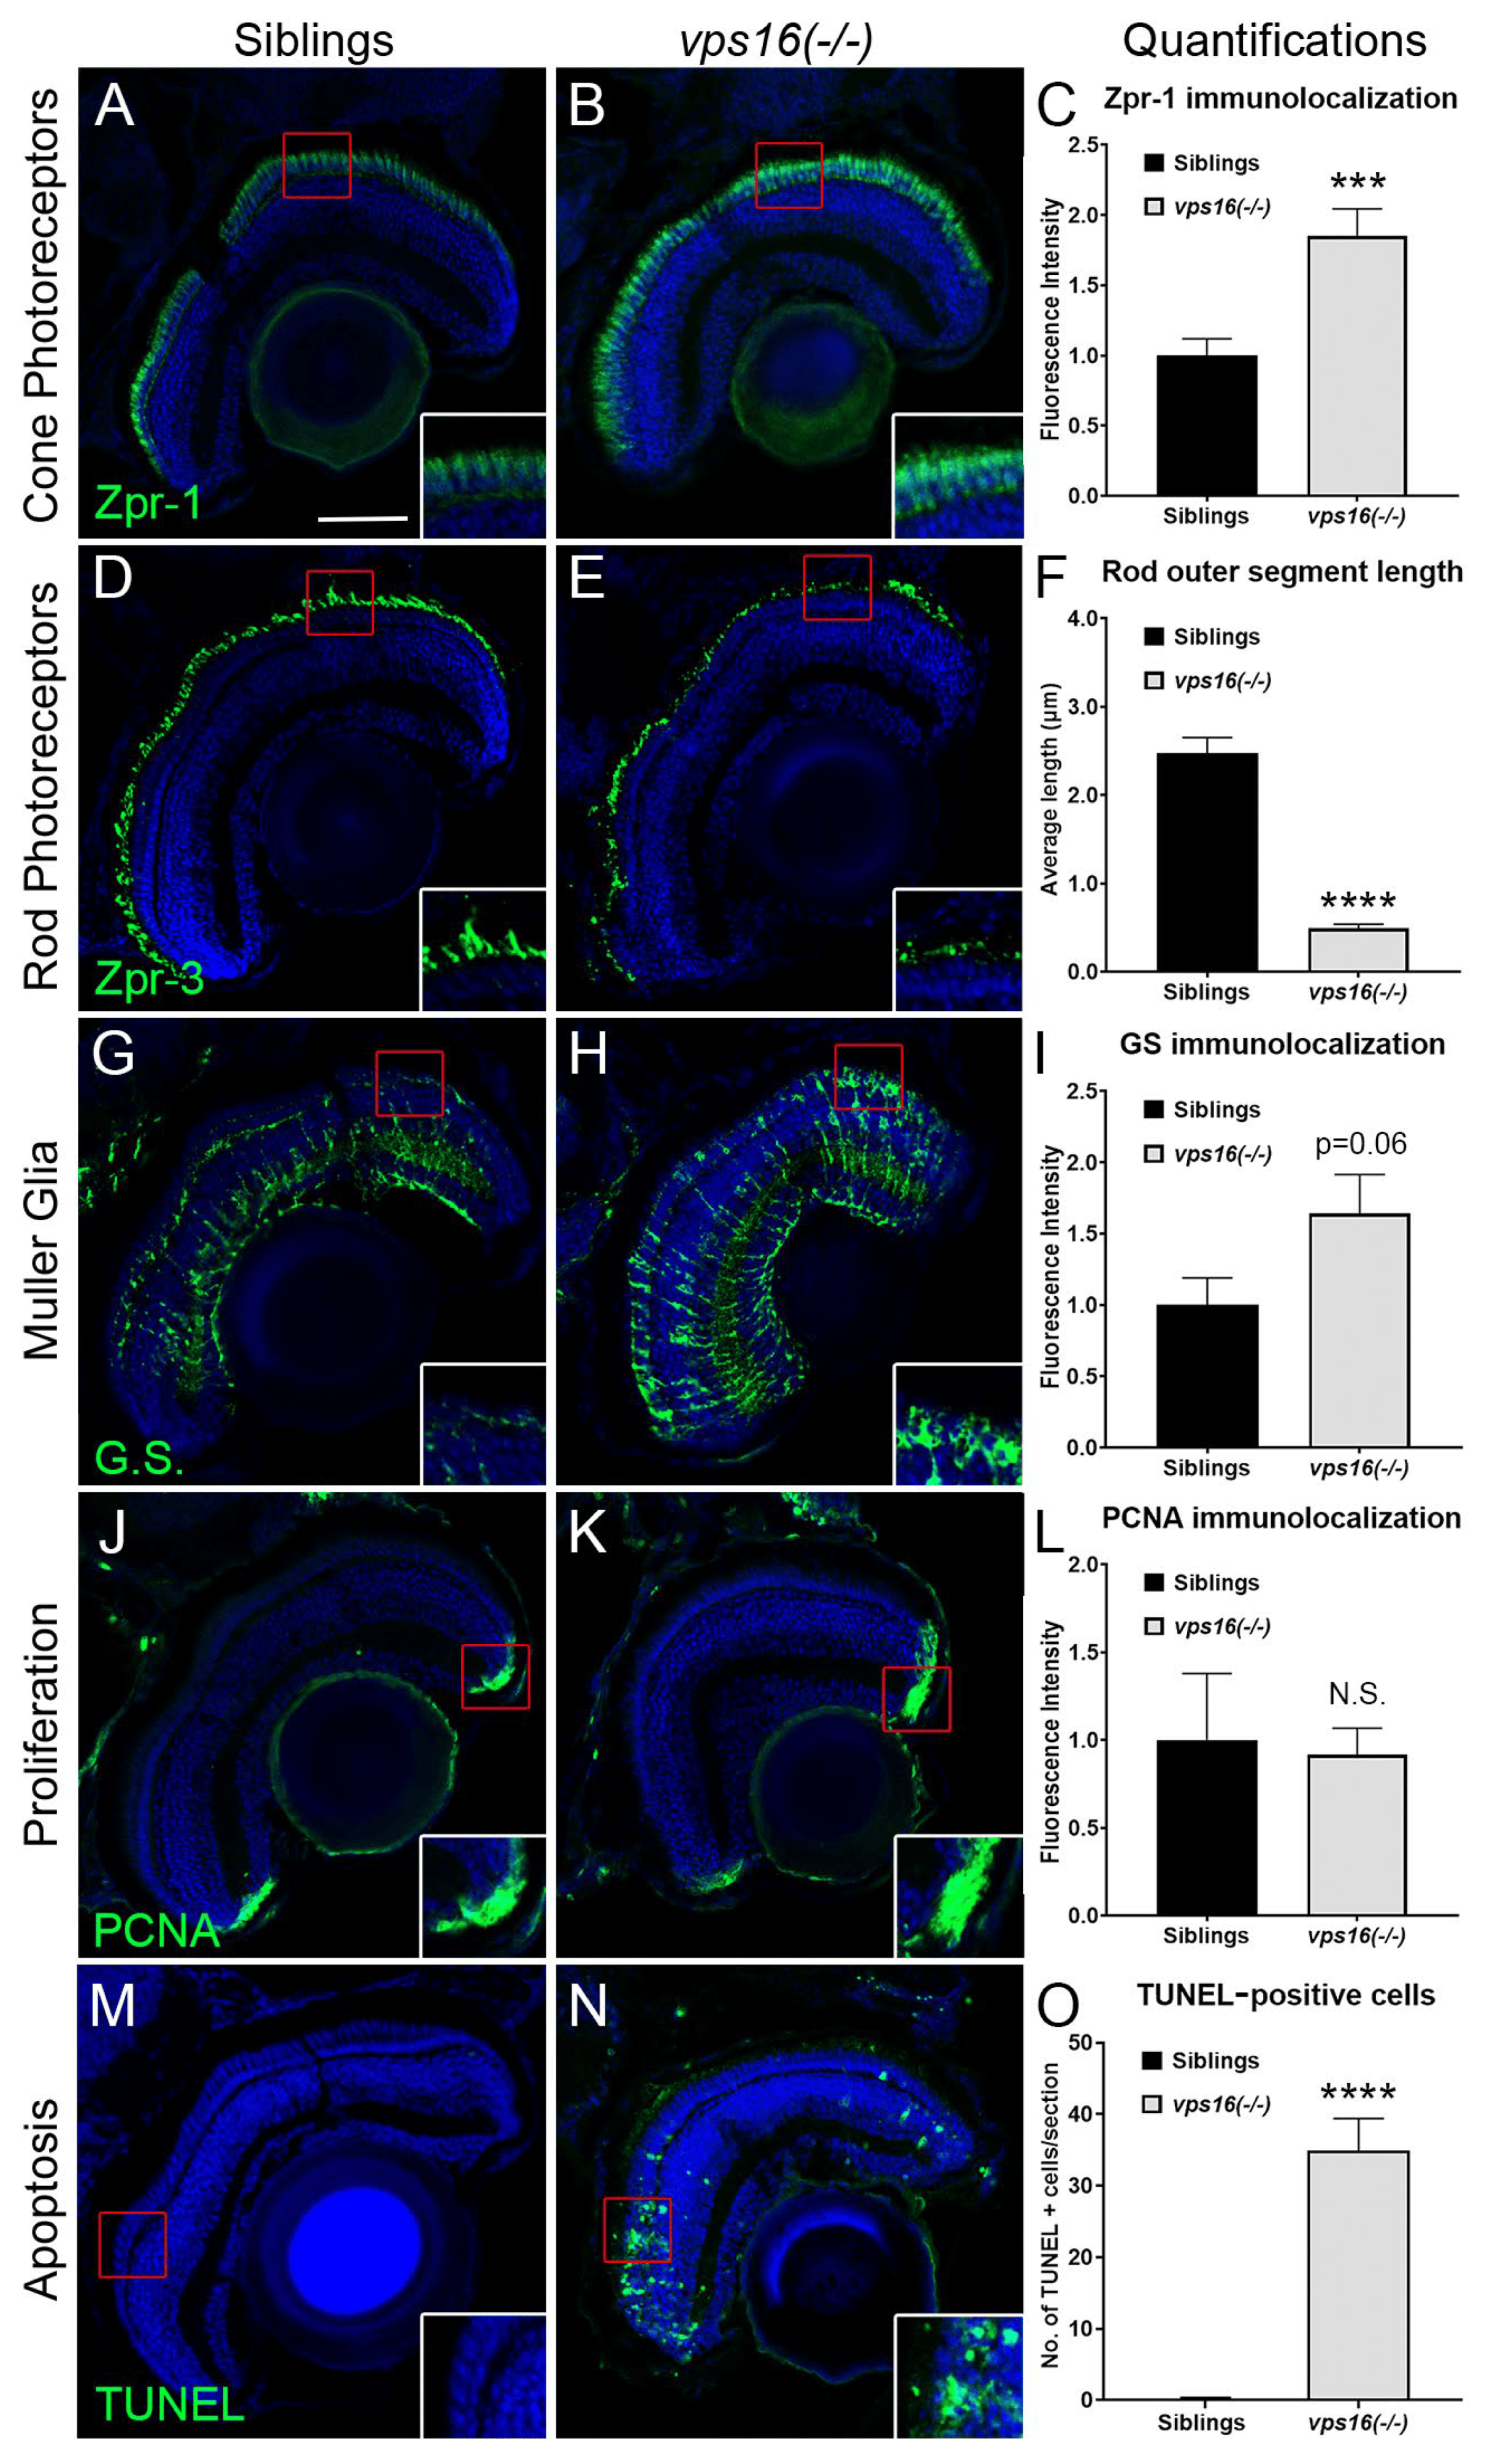
Fig. 2 vps16(-/-) mutants at 7 dpf show retinal pathology including photoceptor degeneration, reactive gliosis of Müller glia (MG), and cell death. (A,B) Immunolocalization of Arrestin (Zpr-1) (green) in double cone photoreceptors. (A) Siblings (n = 15) show normal Zpr-1 immunolabeling in perinuclear domain of red/green double cones. (B) Zpr-1 immunolabeling observed throughout cytoplasm of hypertrophied and degenerating cones in vps16(-/-) mutants (n = 18). (C) Graph representing quantification of Zpr-1 immunolocalization in 7 dpf siblings and vps16(-/-) mutants. *** p = 0.0009. (D,E) Immunolocalization of Zpr-3 (green) in outer segments of rod photoreceptors. (D) Outer segments of healthy rod photoreceptors in siblings (n = 13) show normal length and structure. (E) Truncated outer segments of degenerating rod photoreceptors observed in vps16(-/-) mutants (n = 11). (F) Graph representing quantification of average length of rod outer segments immunolabeled with Zpr-3 in 7 dpf siblings and vps16(-/-) mutants. **** p < 0.0001. (G,H) Immunolocalization of glutamine synthetase (G.S.) (green) in MG. (G) Normal levels of G.S. immunolabeling in outer regions of MG of siblings (n = 14). (H) G.S. immunolabeling in ends of MG in outer retina showing reactive gliosis in vps16(-/-) mutants (n = 18). (I) Graph representing quantification of G.S. immunolocalization in 7 dpf siblings and vps16(-/-) mutants. p = 0.06. (J,K) Immunolocalization of PCNA-positive retinal progenitors (green) in CMZ. (J) PCNA-positive retinal progenitors shown in CMZ of siblings (n = 9). (K) Normal population of PCNA-positive retinal progenitors shown in CMZ of vps16(-/-) mutants (n = 8). (L) Graph representing quantification of PCNA immunolocalization in retinal CMZ of 7 dpf siblings and vps16(-/-) mutants. “N.S.” = not significant. (M–O) TUNEL-positive cells (green) in retinal sections. (M) Minimal to no TUNEL-positive apoptotic cells seen in sibling retina (n = 16). (N) Large number of TUNEL-positive apoptotic cells observed in vps16(-/-) mutant retina (n = 16), specifically in outer nuclear layer. (O) Graph representing quantification of average number of TUNEL-positive apoptotic cells in retinal sections of 7 dpf siblings and vps16(-/-) mutants. **** p < 0.0001. Scale bar in panel A = 50 microns for all images. Blue = TO-PRO-3, a nuclear stain. Error bars indicate SEM.