
|
Figure 1
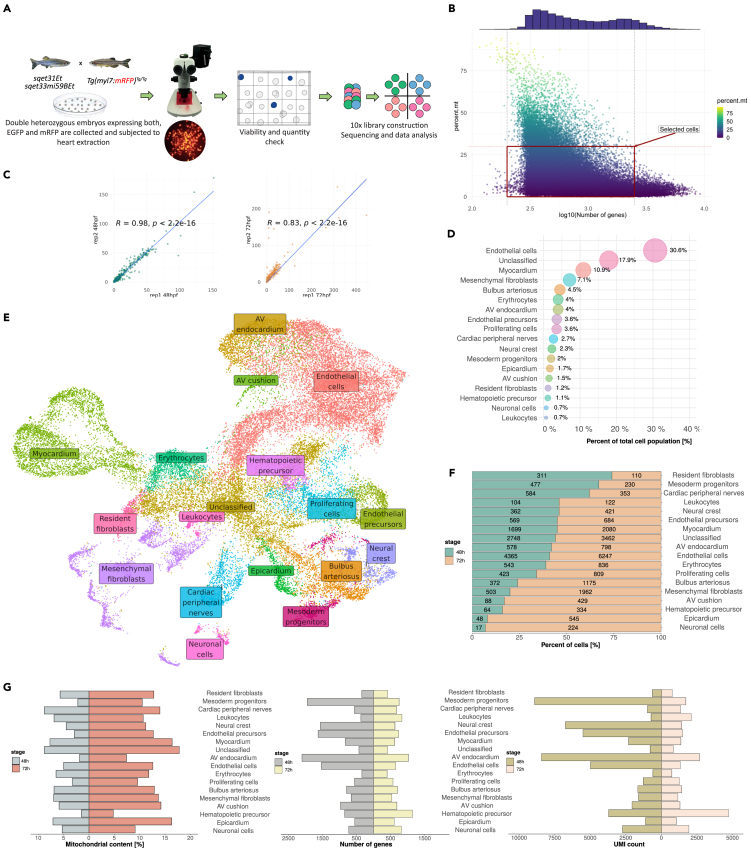
Single-cell RNA sequencing revealed 18 distinct cell subtypes of the embryonic zebrafish heart
(A) Schematic overview of experimental design and workflow.
(B) Quality parameters of all cells derived from 48 to 72 hpf pseudo-replicates showing the number of expressed genes and mitochondrial gene content. Cells within the red frame were included in the downstream analysis.
(C) Pearson correlation between developmental pseudo-replicates at both 48 hpf and 72 hpf.
(D) Percent of total cell population contributing to each cluster.
(E) Integrated UMAP projection depicting cell clusters that constitute the embryonic zebrafish heart.
(F) Visual representation of cluster composition expressed as a percentage indicating the number of cells contributing to each cluster depending on developmental stage.
(G) General quality metrics reflecting the percent of mitochondrial genes, the total number of genes, and UMI expressed in each cell cluster at a particular developmental stage.