
|
Figure 2
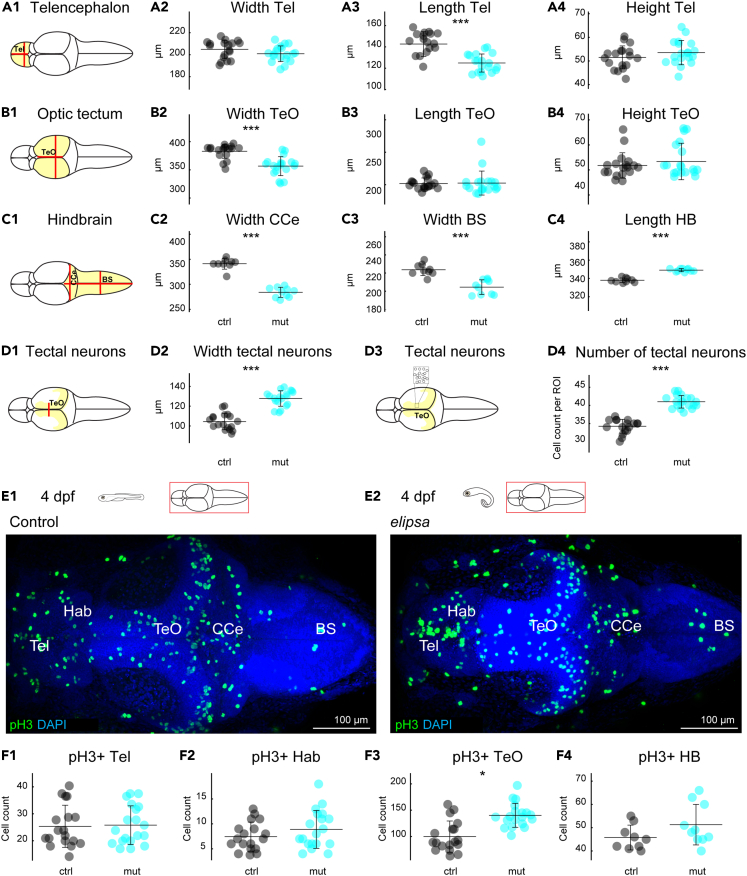
Cilia defects lead to abnormal brain size and alters cell proliferation in the optic tectum
(A1–D4) Quantification of brain morphology of 4 dpf larval brains for control (black) and
(E1 and E2) staining for mitotic cells using an anti-pH3 antibody.
(F1–F4) Cell count for pH3 positive cells (pH3+) in telencephalon (F1), habenula (F2), optic tectum (F3) and hindbrain (F4). ∗: