Image
Figure Caption
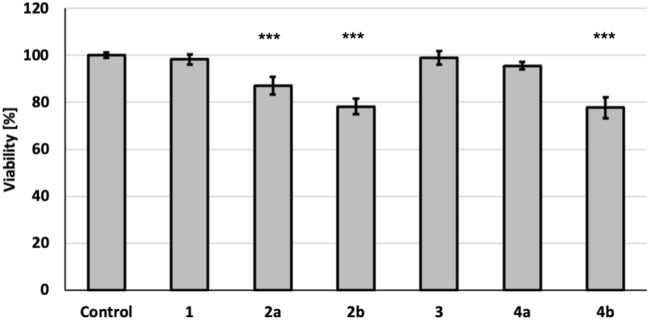
Figure 3
The viability of HaCaT cells after 72 h incubation with tested compounds at the concentration of 100 μM. Data represent mean percentage viability ± standard error of measurement (SEM) estimated for the control (untreated cells, assumed as 100%) from at least 3 independent experiments performed in triplicate. ***p < 0.0001 compared to the control.
Acknowledgments
This image is the copyrighted work of the attributed author or publisher, and
ZFIN has permission only to display this image to its users.
Additional permissions should be obtained from the applicable author or publisher of the image.
Full text @ Sci. Rep.

