
|
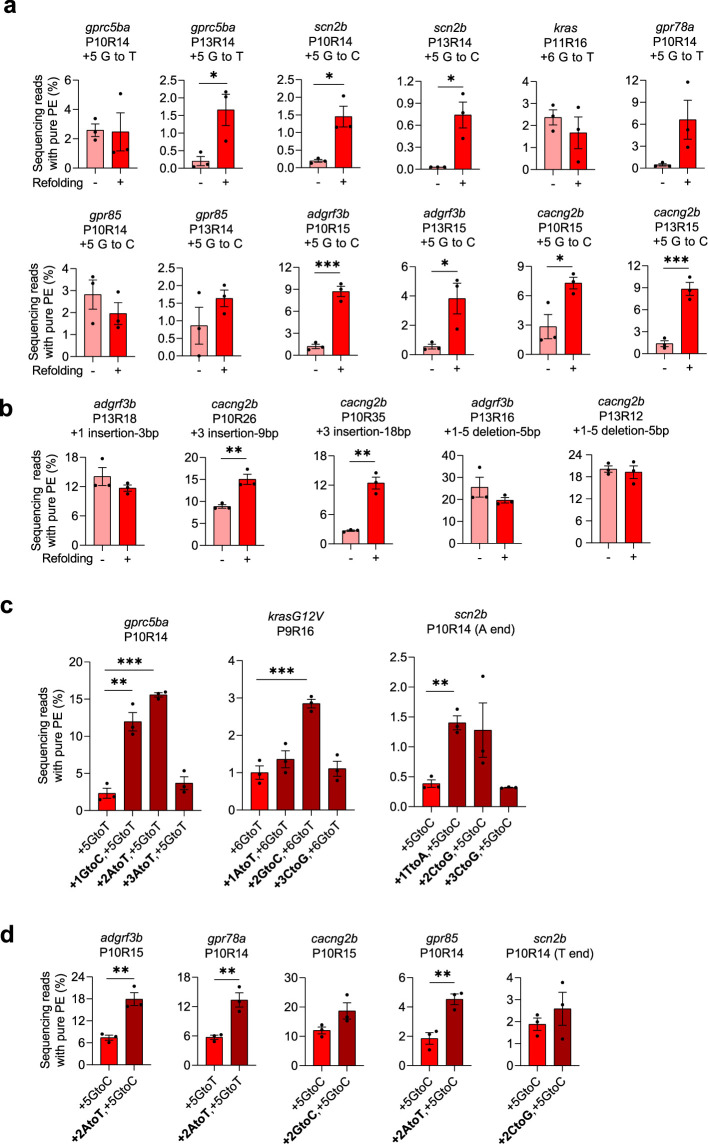
Figure 2 Improving prime editing efficiencies in zebrafish by pegRNA refolding and mutations in RTT. (a–b) Pure PE frequencies of non-refolded and refolded substitution pegRNAs (a) and insertion or deletion pegRNAs (b) with PE2 in zebrafish. Target loci, PBS lengths (labeled as ‘P’ followed by the number of nucleotides), RTT lengths (labeled as ‘R’ followed by the number of nucleotides), and pegRNA-specified edits (denoted as the position of the edit followed by the edit) are shown at the top. Pure PE represents sequencing reads containing only the pegRNA-specified mutations. (c–d) Pure PE frequencies with refolded pegRNAs carrying additional RTT mutations (at +1,+2 or+3) and PE2 in zebrafish. Target loci, PBS, and RTT lengths are shown at the top and pegRNA-specified edits are shown at the bottom. All pegRNAs had 3 or 4 thymine (T) nucleotides at the 3’ end except for the ones labeled ‘A end’ for scn2b in which the terminal Ts were replaced with adenine (A) nucleotides. Dots represent individual data points (n=3 biologically independent replicates, 5–10 embryos per replicate), bars the mean and error bars ± s.e.m. *p<0.05, **p<0.01, ***p<0.001 (unpaired two-tailed t-test with equal variance).