
|
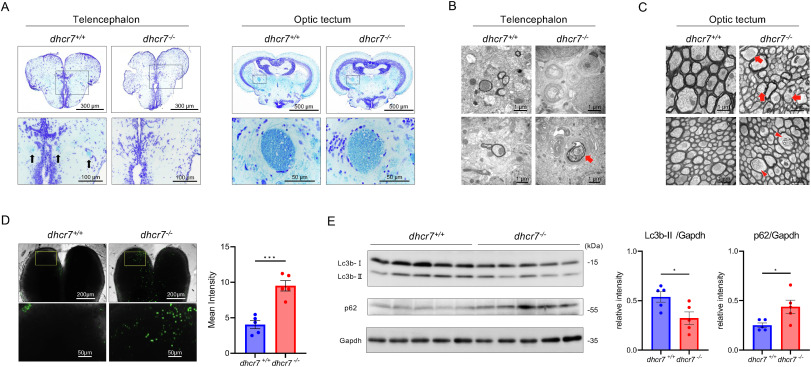
Fig. 3 Impaired myelination and autophagy in dhcr7−/− zebrafish (A) Representative Klüver–Barrera staining of transverse sections of 3-mpf dhcr7+/+ and dhcr7−/− zebrafish telencephalon and optic tectum. Arrows indicate myelin stained in the dhcr7+/+ telencephalon. (B), (C) Representative transmission electron micrographs of the telencephalon (B) and optic tectum (C) from 2-mpf dhcr7+/+ and dhcr7−/− zebrafish. Arrows indicate axonal lysosome-like structures; arrowheads indicate mitochondria with indistinct cristae, which appeared expanded. (D) Lysosome staining by Lysoprime Green in 2-mpf dhcr7+/+ and dhcr7−/− zebrafish telencephalon (n = 5 each). (E) Western blot analysis of p62 and Lc3b protein levels in 2-mpf dhcr7+/+ and dhcr7−/− zebrafish brains (n = 5 each) relative to GAPDH. All values are presented as the mean ± SEM. *p < 0.05. (For interpretation of the references to colour in this figure legend, the reader is referred to the Web version of this article.)