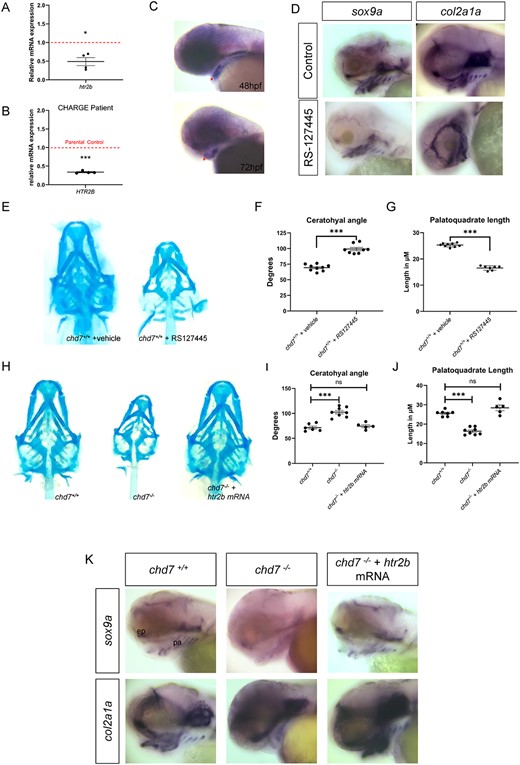
Fig. 5 Role of Htr2b in craniofacial development. (A) RT-qPCR of htr2b at 3dpf, relative fold change in comparison to chd7+/+(N = 4). (B) RT-qPCR of HTR2B mRNA in a LCL from a CS patient in comparison to parental controls (N = 4). (C) WISH of htr2b in 48 hpf and 72hpf zebrafish, lateral view. Red asterisk indicates expression in craniofacial structures. (D) WISH of sox9a and col2a1a in craniofacial regions of control or Htr2b inhibitor treated larvae, lateral view. (E) Alcian blue staining of 6 dpf larvae treated with vehicle (DMF) or Htr2b inhibitor RS127445. (F, G) Statistical analysis of palatoquadrate length and ceratohyal angle in vehicle or inhibitor treated larvae (n = 9 for chd7+/+ and n = 8 for chd7-/-). (H) Alcian blue staining of 6 dpf larvae of wildtype, chd7-/- and chd7-/- injected with htr2b mRNA. (I,J) Statistical analysis of palatoquadrate length and ceratohyal angle chd7-/-(n = 6-7), chd7-/- (n = 8) and chd7-/- injected with htr2b mRNA(n = 5). (K) WISH of sox9a and col2a1a in craniofacial regions of 72hpf wildtype, chd7-/- and chd7-/- injected with htr2b mRNA larvae, lateral view (ep: ethmoid plate and pa: palatoquadrate). Significance of Student’s t-test or ANOVA with: *P < 0.05; **P < 0.01; ***P < 0.001; ns = not significant.
Image
Figure Caption
Figure Data
Acknowledgments
This image is the copyrighted work of the attributed author or publisher, and
ZFIN has permission only to display this image to its users.
Additional permissions should be obtained from the applicable author or publisher of the image.
Full text @ J. Bone Miner. Res.

