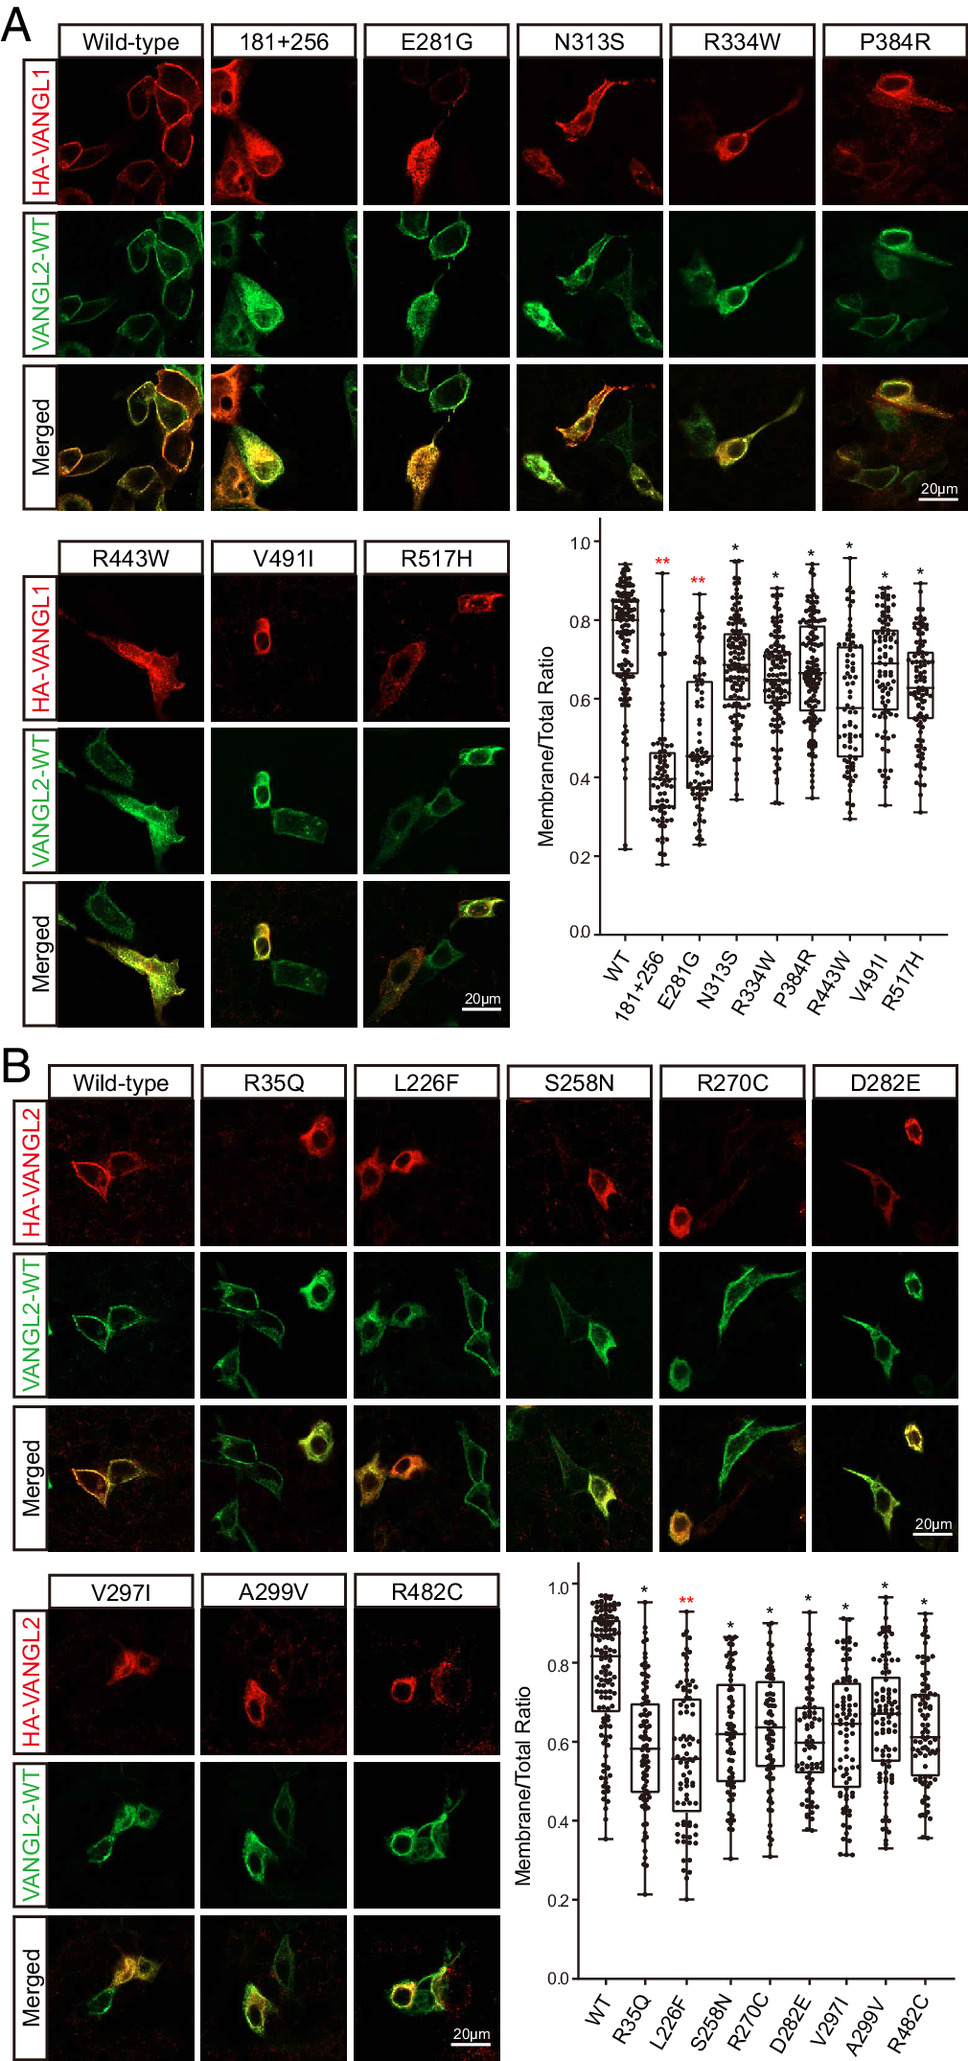
Fig. 4 VANGL1 and VANGL2 variants exhibit dominant-negative effects. (A and B) Colocalization of HA-tagged wild-type and mutant VANGL1/2 (red) with Flag-tagged wild-type VANGL2 (green) in MDCK cells. Membrane localization ratios of wild-type and mutant VANGL1 and VANGL2 were analyzed by ImageJ in more than 100 cells for each group. The significance of the differences was calculated by a one-way ANOVA test, F = 49.04 (A), 17.24 (B). *P < 0.05, **P < 0.01, and the mean difference between wild-type and labeled groups exceeded 0.2. Box plots show the center line as the median, box limits as the upper and lower quartiles, and whiskers as the minimum to maximum values.
Image
Figure Caption
Acknowledgments
This image is the copyrighted work of the attributed author or publisher, and
ZFIN has permission only to display this image to its users.
Additional permissions should be obtained from the applicable author or publisher of the image.
Full text @ Proc. Natl. Acad. Sci. USA

