
|
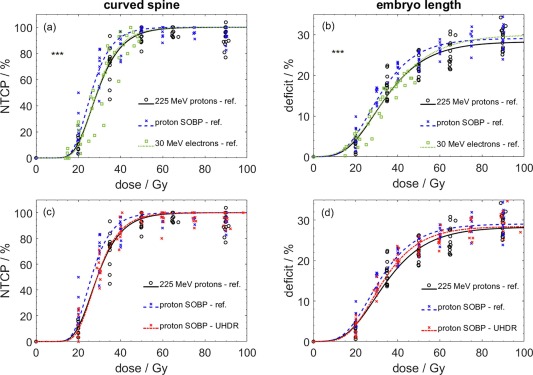
Fig. 2 Panel (a) and (b): Dose-effect curves determined for 5 days-old ZFE following irradiation with 225 MeV protons (solid lines and circles), in a proton SOBP (dashed lines and crosses) and 30 MeV electrons (dotted lines and squares) at reference dose rate (between 6 and 32 Gy/min). Panel (c) and (d): Dose-effect curves for irradiation at reference dose rate with 225 MeV protons (solid lines and circles) and in a proton SOBP (dashed lines and dark crosses) compared to the proton SOBP dose–effect curve at UHDR (dot-dashed lines and light crosses). Panel (a) and (c) show data for the curved spine endpoint and panel (b) and (d) for the embryo length deficit endpoint. The *** symbol indicates a highly significant RBE increase of the SOBP compared to the monoenergetic 225 MeV protons and 30 MeV electrons.