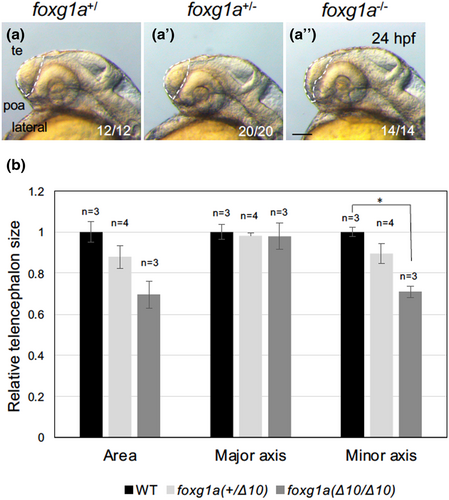
Fig. 6 Quantification of the size of the telencephalon in foxg1a mutants. The sizes of the telencephalon were quantified using ImageJ. The telencephalic region was selected by the segmented line tool for each genotype as shown in (a–a″) (white dashed lines), and the area was quantified (b). (a–a″) Lateral views of the head, with anterior to the left and dorsal to the top. The embryos in (a) and (a″) correspond to those in Figure 3a, b. poa, preoptic area; te, telencephalon. Scale bar, 100 μm. (b) Four clutches were quantified independently, resulting in similar results, and representative data are shown. Average values for respective genotypes are shown relative to those for the wild-type embryos with error bars showing SEMs and the numbers of embryos scored in this experiment. *p < .05. Numbers at the bottom right in (a–a″) indicate the total numbers of embryos showing the features shown and the total numbers of scored embryos with respective genotypes, respectively, all of which are combined numbers from the four independent experiments.
Image
Figure Caption
Figure Data
Acknowledgments
This image is the copyrighted work of the attributed author or publisher, and
ZFIN has permission only to display this image to its users.
Additional permissions should be obtained from the applicable author or publisher of the image.
Full text @ Dev. Growth Diff.

