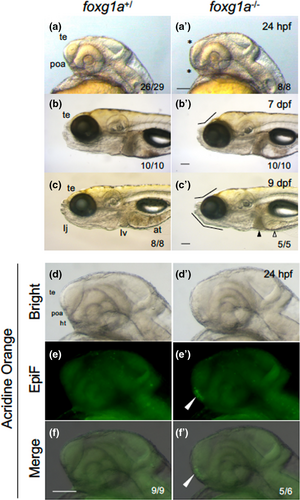
Fig. 5 Morphological defects in foxg1a mutant fish. (a–c, a′–c′) Morphology of the heads of embryos/larvae obtained by heterozygotic mating of foxg1a mutant fish (foxg1a+/∆10) was observed at 24 hpf (a, a′), 7 dpf (b, b′), and 9 dpf (c, c′), followed by genotyping. For each stage, wild-type fish and homozygotes (−/−) are shown. In fact, heterozygotes were indistinguishable from wild-type embryos and are not shown. In homozygotes, the telencephalon was thinner and the POA region was deformed at 24 hpf (asterisks, a′). At 7 and 9 dpf, depression of the anterodorsal head and reduced lower jaws were observed (flexed lines, b′, c′), cell death was observed in the liver (solid triangle), and the alimentary tract was often empty (open triangle). (d–f, d′–f′) Embryos obtained by heterozygotic mating of foxg1a mutant fish (foxg1a+/Δ10) were examined by acridine orange (AO) staining at 24 hpf and then genotyped. Wild type and homozygotes are shown on the left and right, respectively. Heterozygotes were indistinguishable from wild-type embryos and are not shown. Lateral views of the head, with anterior to the left and dorsal to the top. Bright-field images, epifluorescence images (EpiF), and merged images are shown from top to bottom. On the bottom right are shown the numbers of embryos with the shown phenotypes and the numbers of embryos with the shown genotypes, respectively. at, alimentary tract; ht, hypothalamus; poa, preoptic area; te, telencephalon. Scale bar, 100 μm.
Image
Figure Caption
Figure Data
Acknowledgments
This image is the copyrighted work of the attributed author or publisher, and
ZFIN has permission only to display this image to its users.
Additional permissions should be obtained from the applicable author or publisher of the image.
Full text @ Dev. Growth Diff.

