
|
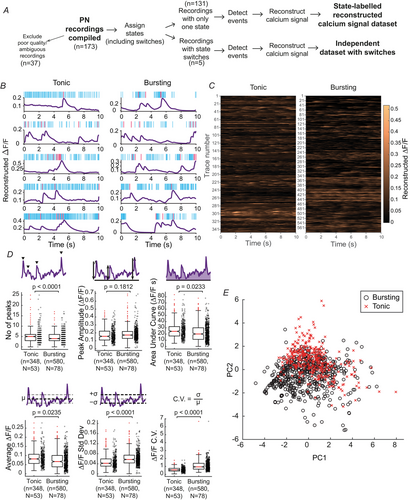
Fig. 4 GENERATING A LABELLED DATASET OF RECONSTRUCTED CALCIUM SIGNAL TRACES A, flowchart showing how electrophysiological recordings from PNs were processed to generate the state-labelled calcium signal database. B, representative randomly sampled traces from the state-labelled reconstructed calcium signal dataset. The left column has reconstructions from tonic cells and the right column has reconstructions from bursting cells. Above each trace is the raster showing the events in the source recording, with simple spikes in cyan, and CF inputs in magenta. C, heatmaps representing all the reconstructions in the state-labelled calcium signal dataset, for each state, after splitting all traces into 10-s-long non-overlapping chunks. (n = 348 tonic traces; n = 580 bursting traces). D, comparing the distribution of trace properties for both states. The top three plots show (from left to right) the number of peaks, peak amplitude and area under the curve of the reconstructions in the dataset. The bottom three plots show (from left to right) the mean, standard deviation and the coefficient of variation of ΔF/F values. n values are the number of 10 s long samples. N values are the number of cells used to generate the samples. P values were computed using linear mixed-effects models. E, principal components analysis of trace properties, with data points marked by state: tonic (red crosses) and bursting (black open circles).