
Image
|
Figure Caption
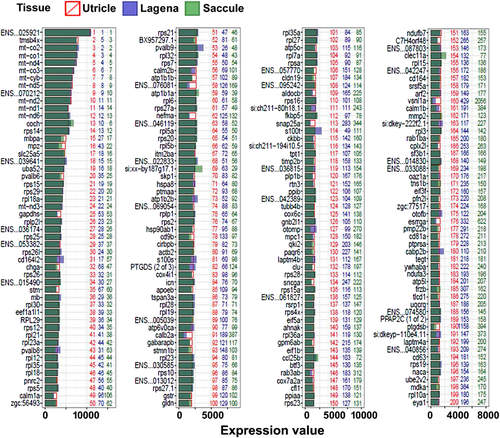
Fig. 3 Expression levels of top 200 genes in the utricle. The bars show the fluorescent density of each gene after normalization. Numbers in green, red, and blue represent the abundance rank of the genes in the saccule, utricle, and lagena respectively
Acknowledgments
This image is the copyrighted work of the attributed author or publisher, and
ZFIN has permission only to display this image to its users.
Additional permissions should be obtained from the applicable author or publisher of the image.
Full text @ Anat. Rec. (Hoboken)