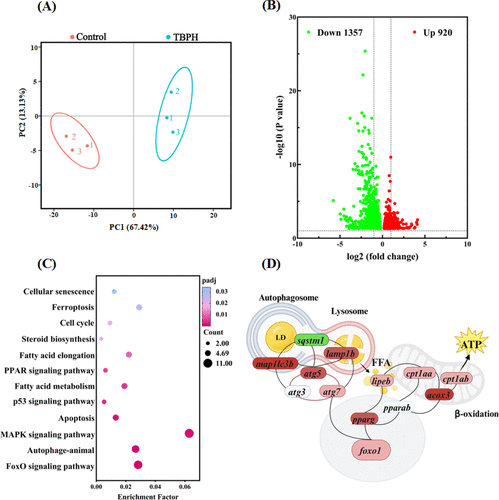
Fig. 3 Transcriptomic analysis in zebrafish larvae after exposure to TBPH. (A) PCA plots. (B) Volcano plots. (C) KEGG enrichment. (D) Coregulatory network of DEGs. The red, green, and white ellipses represent upregulation, downregulation, and no significant changes, respectively. The color intensity represents the P value. foxo1: forkhead box O1; pparg and pparab: peroxisome proliferator-activated receptor gamma and alpha b; lc3 (map1lc3bm): map1lc3bmicrotubule-associated protein 1 light chain 3 beta; atg3,5,7: autophagy related 3,5,7; sqstm1: sequestosome 1; lamp1b: lysosomal associated membrane protein 1b; lipeb: lipase, hormone-sensitive b; cpt1aa and cpt1ab: carnitine palmitoyltransferase 1Aa and 1Ab; acox3: acyl-CoA oxidase 3, pristanoyl.
Image
Figure Caption
Acknowledgments
This image is the copyrighted work of the attributed author or publisher, and
ZFIN has permission only to display this image to its users.
Additional permissions should be obtained from the applicable author or publisher of the image.
Full text @ Env. Sci. Tech.

