
|
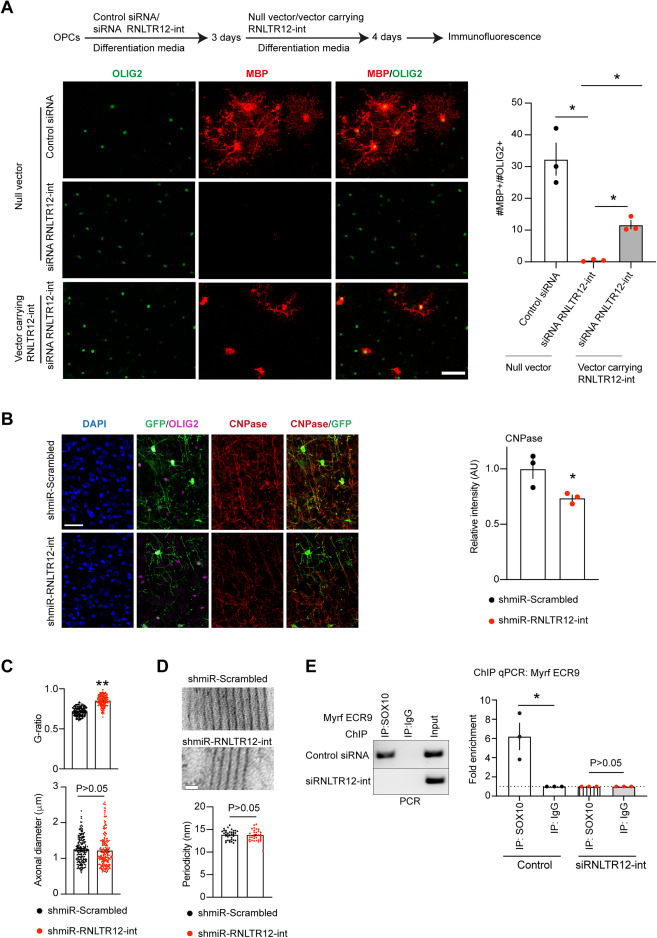
Fig. S5 Effects of RNLTR12-int modulation on oligodendrocyte differentiation, myelination, and gene regulation, related to Figures 2, 3, and 4 (A) Overexpression of RNLTR12-int restores MBP expression in RNLTR12-int siRNA-silenced differentiating OPCs. pcDNA 3.1 (+) bearing a full-length RNLTR12-int consensus sequence or null vector was transfected 3 days after siRNA administration (schema above). Representative immune-stained image (left) and quantification of MBP+ oligodendrocytes (right) shown. ∗adjusted p < 0.05, Brown-Forsythe and Welch’s ANOVA (Benjamini-Hochberg FDR post test), mean ± SEM, n = 3 independent experiments. Scale bars, 45 μm. (B) CNPase expression is affected due to inhibition of RNLTR12-int during developmental myelination in rats. AAV carrying the construct (shown in Figure 3A) were injected into newborn rat brain (at P1). Brains were harvested at P14 for immunofluorescence. Left: immunofluorescence analysis using antibody to CNPase, GFP, and OLIG2. Right: CNPase intensities were quantified and plotted relative to shmiR-Scrambled-infected samples. n = 3 different rats, mean ± SEM, ∗p < 0.05, Student’s t test (unpaired and two tailed). Scale bars, 30 μm. (C and D) AAV carrying the construct (shown in Figure 3A) were injected to the corpus callosum at P6 rats and brains were harvested at P21 for TEM. (C) G-ratios but not the axonal diameters differ due to inhibition of RNLTR12-int. G-ratios (top) and axonal diameters (bottom) were plotted. n = 183 (for shmiR-Scrambled) to 203 (shmiR-RNLTR12-int) axons from three different rats. Mean ± SEM, ∗∗p < 0.0001, Student’s t test (unpaired and two tailed) with Welch’s correction. (D) Periodicity remained similar due to RNLTR12-int inhibition. TEM images shown (top). Scale bars, 20 nm. Bottom: average periodicity values were plotted. n = 35–36 myelin sheath images were used from three different rats. For each image an average of 2–5 different measurements were taken. Mean ± SEM, p > 0.05, Student’s t test (unpaired and two tailed). (E) SOX10 occupancy to Myrf promoter is affected due to inhibition of RNLTR12-int as determined by ChIP analysis 4 days after siRNA transfection. Left: SOX10 binding conserved region (ECR9)24 in the intron 1 of Myrf gene was PCR amplified (amplified region: chr1: 233229291–233229458 [rn5], strand: [−]) from the immunoprecipitated DNA and run on 2% agarose gel. Right: qPCR analysis after ChIP. n = 3 independent experiments. Mean ± SEM, ∗p < 0.05, ratio paired t test (two-sided).
Reprinted from Cell, 187, Ghosh, T., Almeida, R.G., Zhao, C., Mannioui, A., Martin, E., Fleet, A., Chen, C.Z., Assinck, P., Ellams, S., Gonzalez, G.A., Graham, S.C., Rowitch, D.H., Stott, K., Adams, I., Zalc, B., Goldman, N., Lyons, D.A., Franklin, R.J.M., A retroviral link to vertebrate myelination through retrotransposon-RNA-mediated control of myelin gene expression, 814830.e23814-830.e23, Copyright (2024) with permission from Elsevier. Full text @ Cell