IMAGE

Fig 1

ID
ZDB-IMAGE-240416-34
Source
Figures for Jiang et al., 2024
Image
Figure Caption

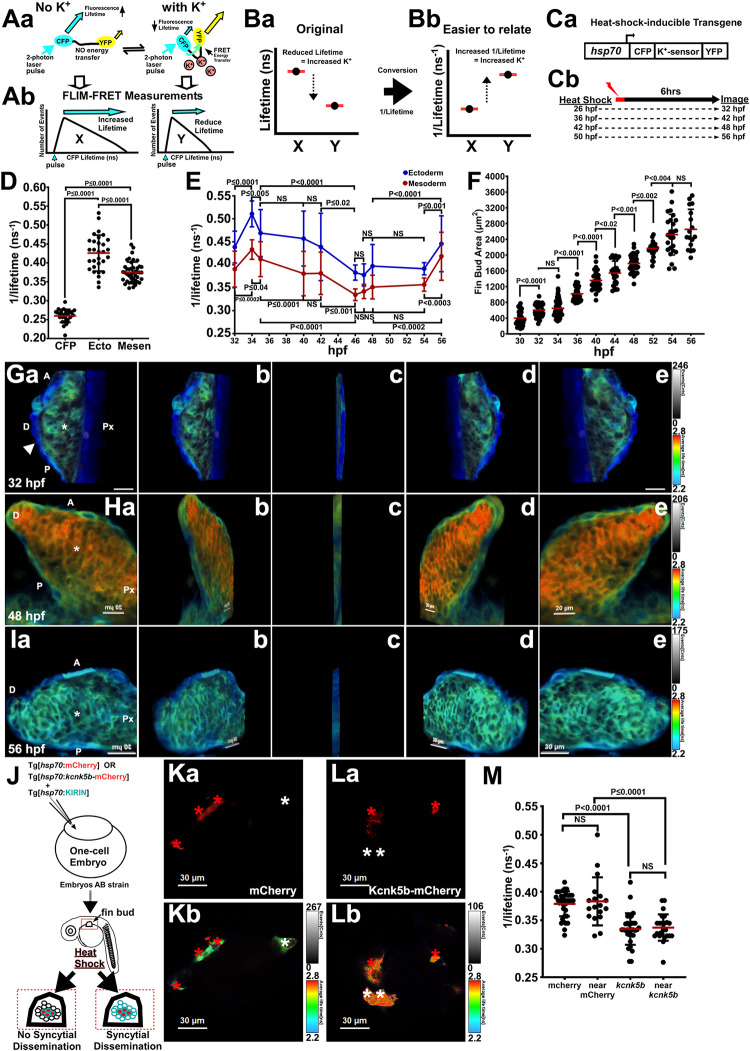
Fig 1 Intracellular K+ decreases during pectoral fin bud growth.

(A) FRET-based mechanism of detection of intracellular K+ by KIRIN1 sensor and application of FLIM assessment. Changes in FRET affect the fluorescence lifetime of the donor fluorophore CFP that is excited by a 2-Photon laser pulse (a). A reduction of intracellular K+ is detected as higher (longer) lifetime of the CFP, while increase in K+ is detected as its lower (shorter) lifetime (b). (B) We depict these lifetime (nanoseconds, ns) relationships of higher lifetime equating to lower intracellular K+ (a) and the inverse (original) as 1/lifetime (ns-1) (b) in order to more easily relate the trend changes with what the FLIM-based measurements are indicating for intracellular K+. (C) Design of K+ sensor (KIRIN1) transgene for transgenic zebrafish line (a). Heat-shock method for inducing transgene during different developmental time points of the fin bud and subsequently FLIM-FRET (FILM) imaging it (b). (D) FLIM measurements of the CFP in confocal sections of ectoderm (Ecto) and mesenchyme (Mesen) in pectoral fin buds at 48 hpf using a FRET-based sensor for K+. Measurements from a transgene containing only CFP that is unable to FRET with YFP. (E) Time course of FLIM measurements of intracellular K+ in the ectodermal and mesenchymal tissues of the developing pectoral fin buds. (F) Time course of growth measurements of the developing fin buds. (G–I) Z-stacks of confocal FLIM planes in fin buds at 32 hpf (G), 48 hpf (H), and 56 hpf (I). Z-stacks cover distances of 15.2 μm (32 hpf), 18.36 μm (48 hpf), and 10.3 μm (56 hpf). The lifetime value of each pixel in the ectoderm (white arrowhead) and the mesenchyme (asterisk) is represented by colors in a rainbow scale from 2.8 ns (blue) to 3.4 ns (red). (J) Generation of fin buds that mosaically express the KIRIN1 sensor and either mCherry or kcnk5b-mCherry (mosaic for 2 transgenes) and proposed outcomes. (Ka,b) Images of cells in fin buds of 56 hpf embryos harboring hsp70:mCherry (red asterisks) and cells lacking the mCherry transgene (white asterisks). Confocal plane for mCherry fluorescence (a). FLIM image of KIRIN1+ cells of the same confocal plane (b). (La,b) Images of cells in fin buds of 56 hpf embryos harboring hsp70:kcnk5b-mCherry (red asterisks) and cells lacking the transgene (white asterisks). Confocal plane for mCherry fluorescence (a). FLIM image of KIRIN1+ cells of the same confocal plane (b). (M) FLIM measurements in fin buds of 56 hpf embryos of indicated cell categories; “near” indicates cells next or distant to mCherry-positive (mCherry+) or kcnk5b-mCherry-positive (kcnk5b+) cells. The graphs are depicted as 1/lifetime (ns-1) to more easily relate the portrayal of the values to the related change in intracellular K+ (see S1A Fig). Experiments were repeated 3 or more time (N ≥ 3). For FLIM, we measured 2 or 3 locations in each tissue of 1 fin bud per embryo. Each measured value is represented as a data point (D, M), except for E, in which the data points are presented as averages and standard deviations of all the measurements (≥11) at each time point. For fin bud size measurements (F), each data point represents 1 fin bud per embryo. P values represent statistical analysis by Student’s two-tailed t test. P values >0.05 are designated as “not significant” (NS). Numerical data used in this figure are included in S1 Data. FLIM, Fluorescence Lifetime Microscopy; FRET, Förster Resonance Energy Transfer; hpf, hours post fertilization.

Acknowledgments
This image is the copyrighted work of the attributed author or publisher, and ZFIN has permission only to display this image to its users. Additional permissions should be obtained from the applicable author or publisher of the image. Full text @ PLoS Biol.