IMAGE

Figure 5

ID
ZDB-IMAGE-240415-133
Source
Figures for Lee et al., 2024
Image
Figure Caption

Figure 5

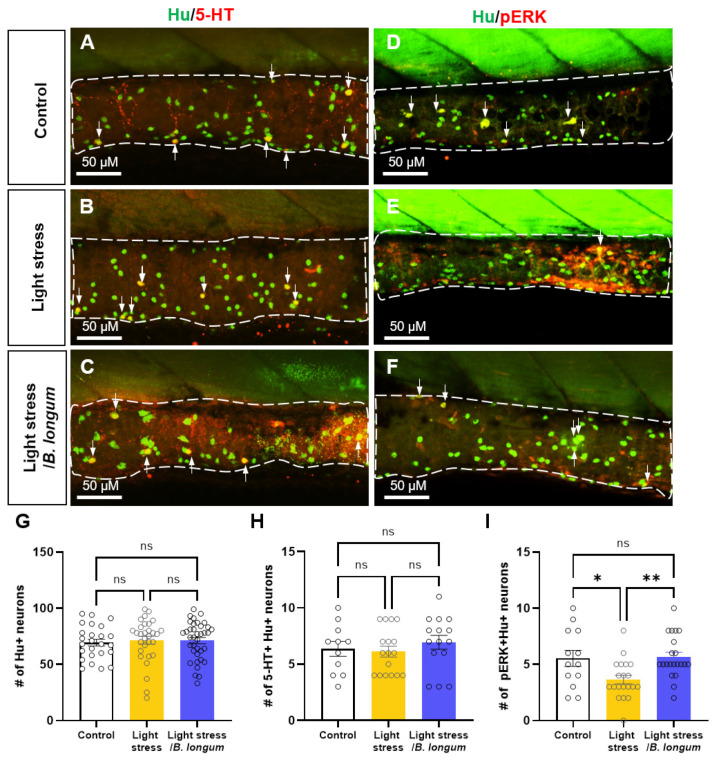
Inflammation-induced activity of enteric neurons. (AC) Intestinal images of 10 dpf larvae labeled with anti-Hu (green) and anti-5-HT (red) antibodies. Arrows indicate 5-HT+/Hu+ neurons in the intestine. Scale bar: 50 μM. (DF) Intestinal images of 10 dpf larvae labeled with anti-Hu (green) and anti-pERK (red) antibodies. Arrows indicate pERK+/Hu+ neurons in the intestine. Scale bar: 50 μM. (G) Comparison of the number (#) of Hu+ enteric neurons among all groups: n = 25 for control group; n = 30 for light-stress group; n = 38 for light-stress/B. longum group. (H) Comparison of the number (#) of 5-HT+/Hu+ serotonin enteric neurons among all groups: n = 12 for control group; n = 17 for light-stress group; n = 15 for light-stress/B. longum group. (I) Comparison of the number (#) of pERK+/Hu+ enteric neurons among all groups: n = 13 for control group; n = 20 for light-stress group; n = 21 for light-stress/B. longum group. ns, not significant; * p < 0.05; ** p < 0.01.

Acknowledgments
This image is the copyrighted work of the attributed author or publisher, and ZFIN has permission only to display this image to its users. Additional permissions should be obtained from the applicable author or publisher of the image. Full text @ Int. J. Mol. Sci.