
Image
|
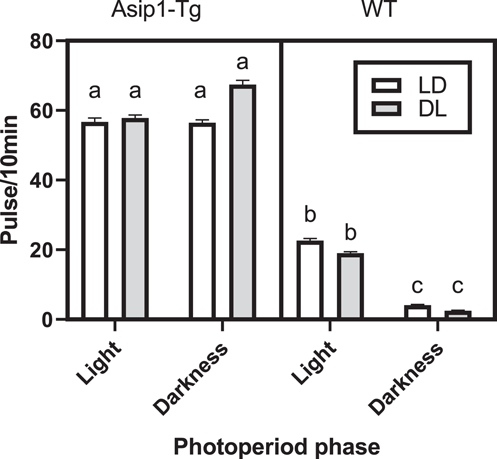
Figure Caption
Fig. 3 Total average locomotor activity (LA) of asip1 Tg (left chart) and wild-type (right chart) animals kept under LD (28 days) and subsequently inverted DL (12 days) photoperiod during the light and darkness phases. Different letter indicates significant differences after two-way analysis of variance (p < .05). See Figure 2 for further details.
Acknowledgments
This image is the copyrighted work of the attributed author or publisher, and
ZFIN has permission only to display this image to its users.
Additional permissions should be obtained from the applicable author or publisher of the image.
Full text @ J. Pineal Res.