IMAGE

Figure 5

ID
ZDB-IMAGE-240328-46
Source
Figures for Cao et al., 2024
Image
Figure Caption

Figure 5

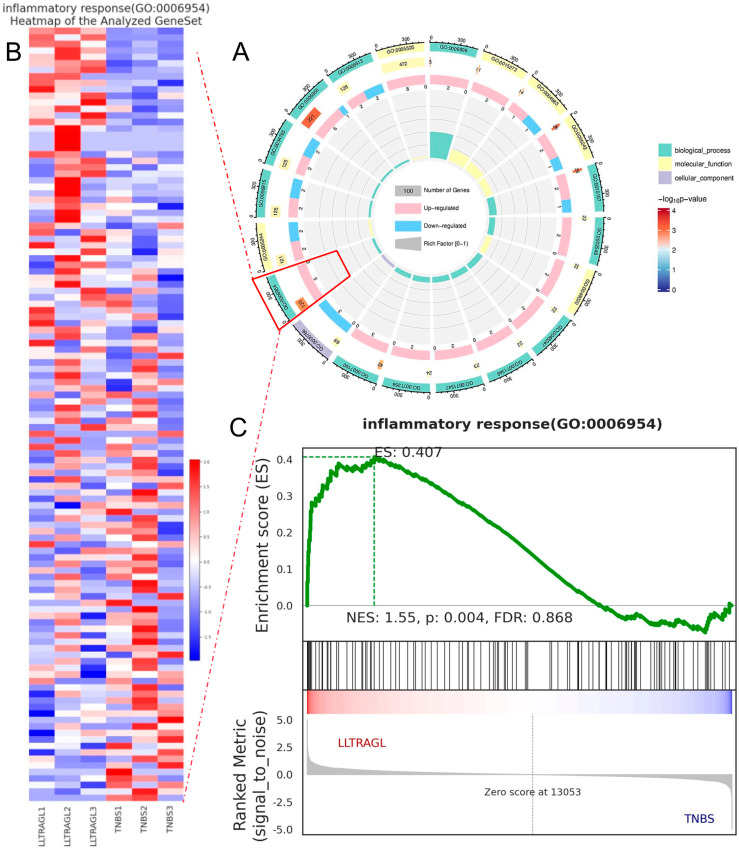
GO enrichment analysis of DEGs and GSEA of all tested genes. (A) Circle plots of the distribution of DEGs in different GO categories. The circle chart shows the distribution of DEGs in the molecular function (MF), biological process (BP), and cellular composition (CC) categories. (B) Grouping clustering diagram of inflammatory response in the GSEA analysis. (C) Analysis Results of the Inflammatory Response Gene Set, mainly including the distribution map of enrichment score (ES), gene distribution map of gene set, and distribution map of the measurement and control bar sorting matrix.

Acknowledgments
This image is the copyrighted work of the attributed author or publisher, and ZFIN has permission only to display this image to its users. Additional permissions should be obtained from the applicable author or publisher of the image. Full text @ Mar. Drugs