IMAGE

Fig. 3

ID
ZDB-IMAGE-240229-180
Source
Figures for Shen et al., 2024
Image
Figure Caption

Fig. 3

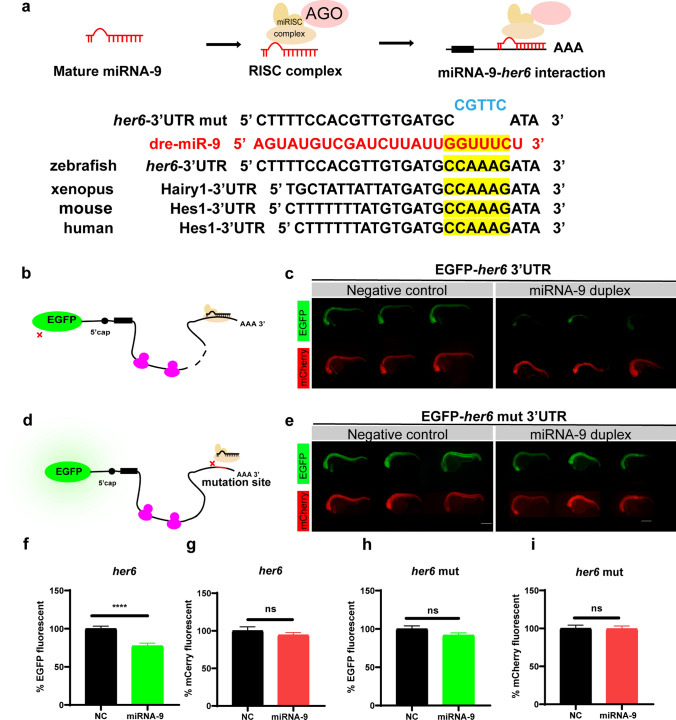
Sequence alignment and the EGFP sensor assay show that her6 is the downstream target of miRNA-9. a Schematic representation of the interaction of miRNA-9 with her6 and sequence comparison of miRNA-9, her6 3ʹUTR, and her6 3ʹUTR mutation (within the 2–7nt mutated). The zebrafish miRNA-9 mature sequence is shown in red, the seed sequence in yellow, and the mutant nucleotide sequence in blue. The homology of her6 seed sequences in humans, mice, Xenopus, and zebrafish is also shown below. b, c EGFP-her6 3′UTR showed strong fluorescent signals when co-injected with non-sense duplex (as negative control), but failed to give fluorescent signals when co-injected with miRNA-9 duplex. mCherry mRNA was injected as a control. d, e EGFP-her6 3′UTR mut showed strong fluorescent signals both in the non-sense duplex and miRNA-9 duplex. f, g The EGFP (f) and mCherry (g) fluorescence was expressed as a percentage of the fluorescent signal observed from the negative control with the EGFP-her6 3′UTR. p < 0.0001 in EGFP fluorescence, p = 0.3404 in mCherry fluorescence, assessed by t-test. h, i The EGFP (h) and mCherry (i) fluorescence were expressed as a percentage of the fluorescent signal observed from the negative control with the EGFP-her6 3′UTR mut. p = 0.1070 in EGFP fluorescence, p = 0.9303 in mCherry fluorescence, assessed by t-test

Acknowledgments
This image is the copyrighted work of the attributed author or publisher, and ZFIN has permission only to display this image to its users. Additional permissions should be obtained from the applicable author or publisher of the image. Full text @ Cell. Mol. Life Sci.